• Link to Youtube
  • Link to LinkedIn
Stanford Center on Longevity
  • ABOUT
    • GENERAL
      • About SCL
      • Annual Reports
      • Contact
    • PEOPLE
      • Leadership, Scholars & Staff
      • New Map of Life Impact Fellows
      • Faculty Affiliates
      • Advisory Council
      • SCL Ambassadors
    • AFFILIATED CENTERS
      • Stanford Distinguished Careers Institute
      • Glenn Foundation for Medical Research
      • Stanford Lifestyle Medicine
  • RESEARCH & INNOVATION
    • The New Map of Life Initiative
    • Postdoctoral Fellows Program
    • The Futures Project on Education and Learning for Longer Lives
    • The Sightlines Project
    • Longevity Design Challenge
    • Publications
  • MEDIA & EVENTS
    • SCL Magazine
    • Longevity Book Club
    • Century Summit
    • Century Lives Podcast
    • SCL in the News
    • Videos
  • ENGAGEMENT OPPORTUNITIES
    • Press inquiries
    • Postdoctoral Fellowship application
    • Industrial Affiliates Program
    • Stanford Courses
    • Make a gift
  • Click to open the search input field Click to open the search input field Search
  • Menu Menu

How well are Americans really doing?

The Sightlines Project offers a data-driven view of how Americans are navigating modern life. By tracking key indicators of well-being across health, financial security, and social engagement, it reveals where progress is happening—and where new approaches are needed. An interactive tool lets you explore how these benchmarks have shifted over time.
Start Exploring

10 BENCHMARKS

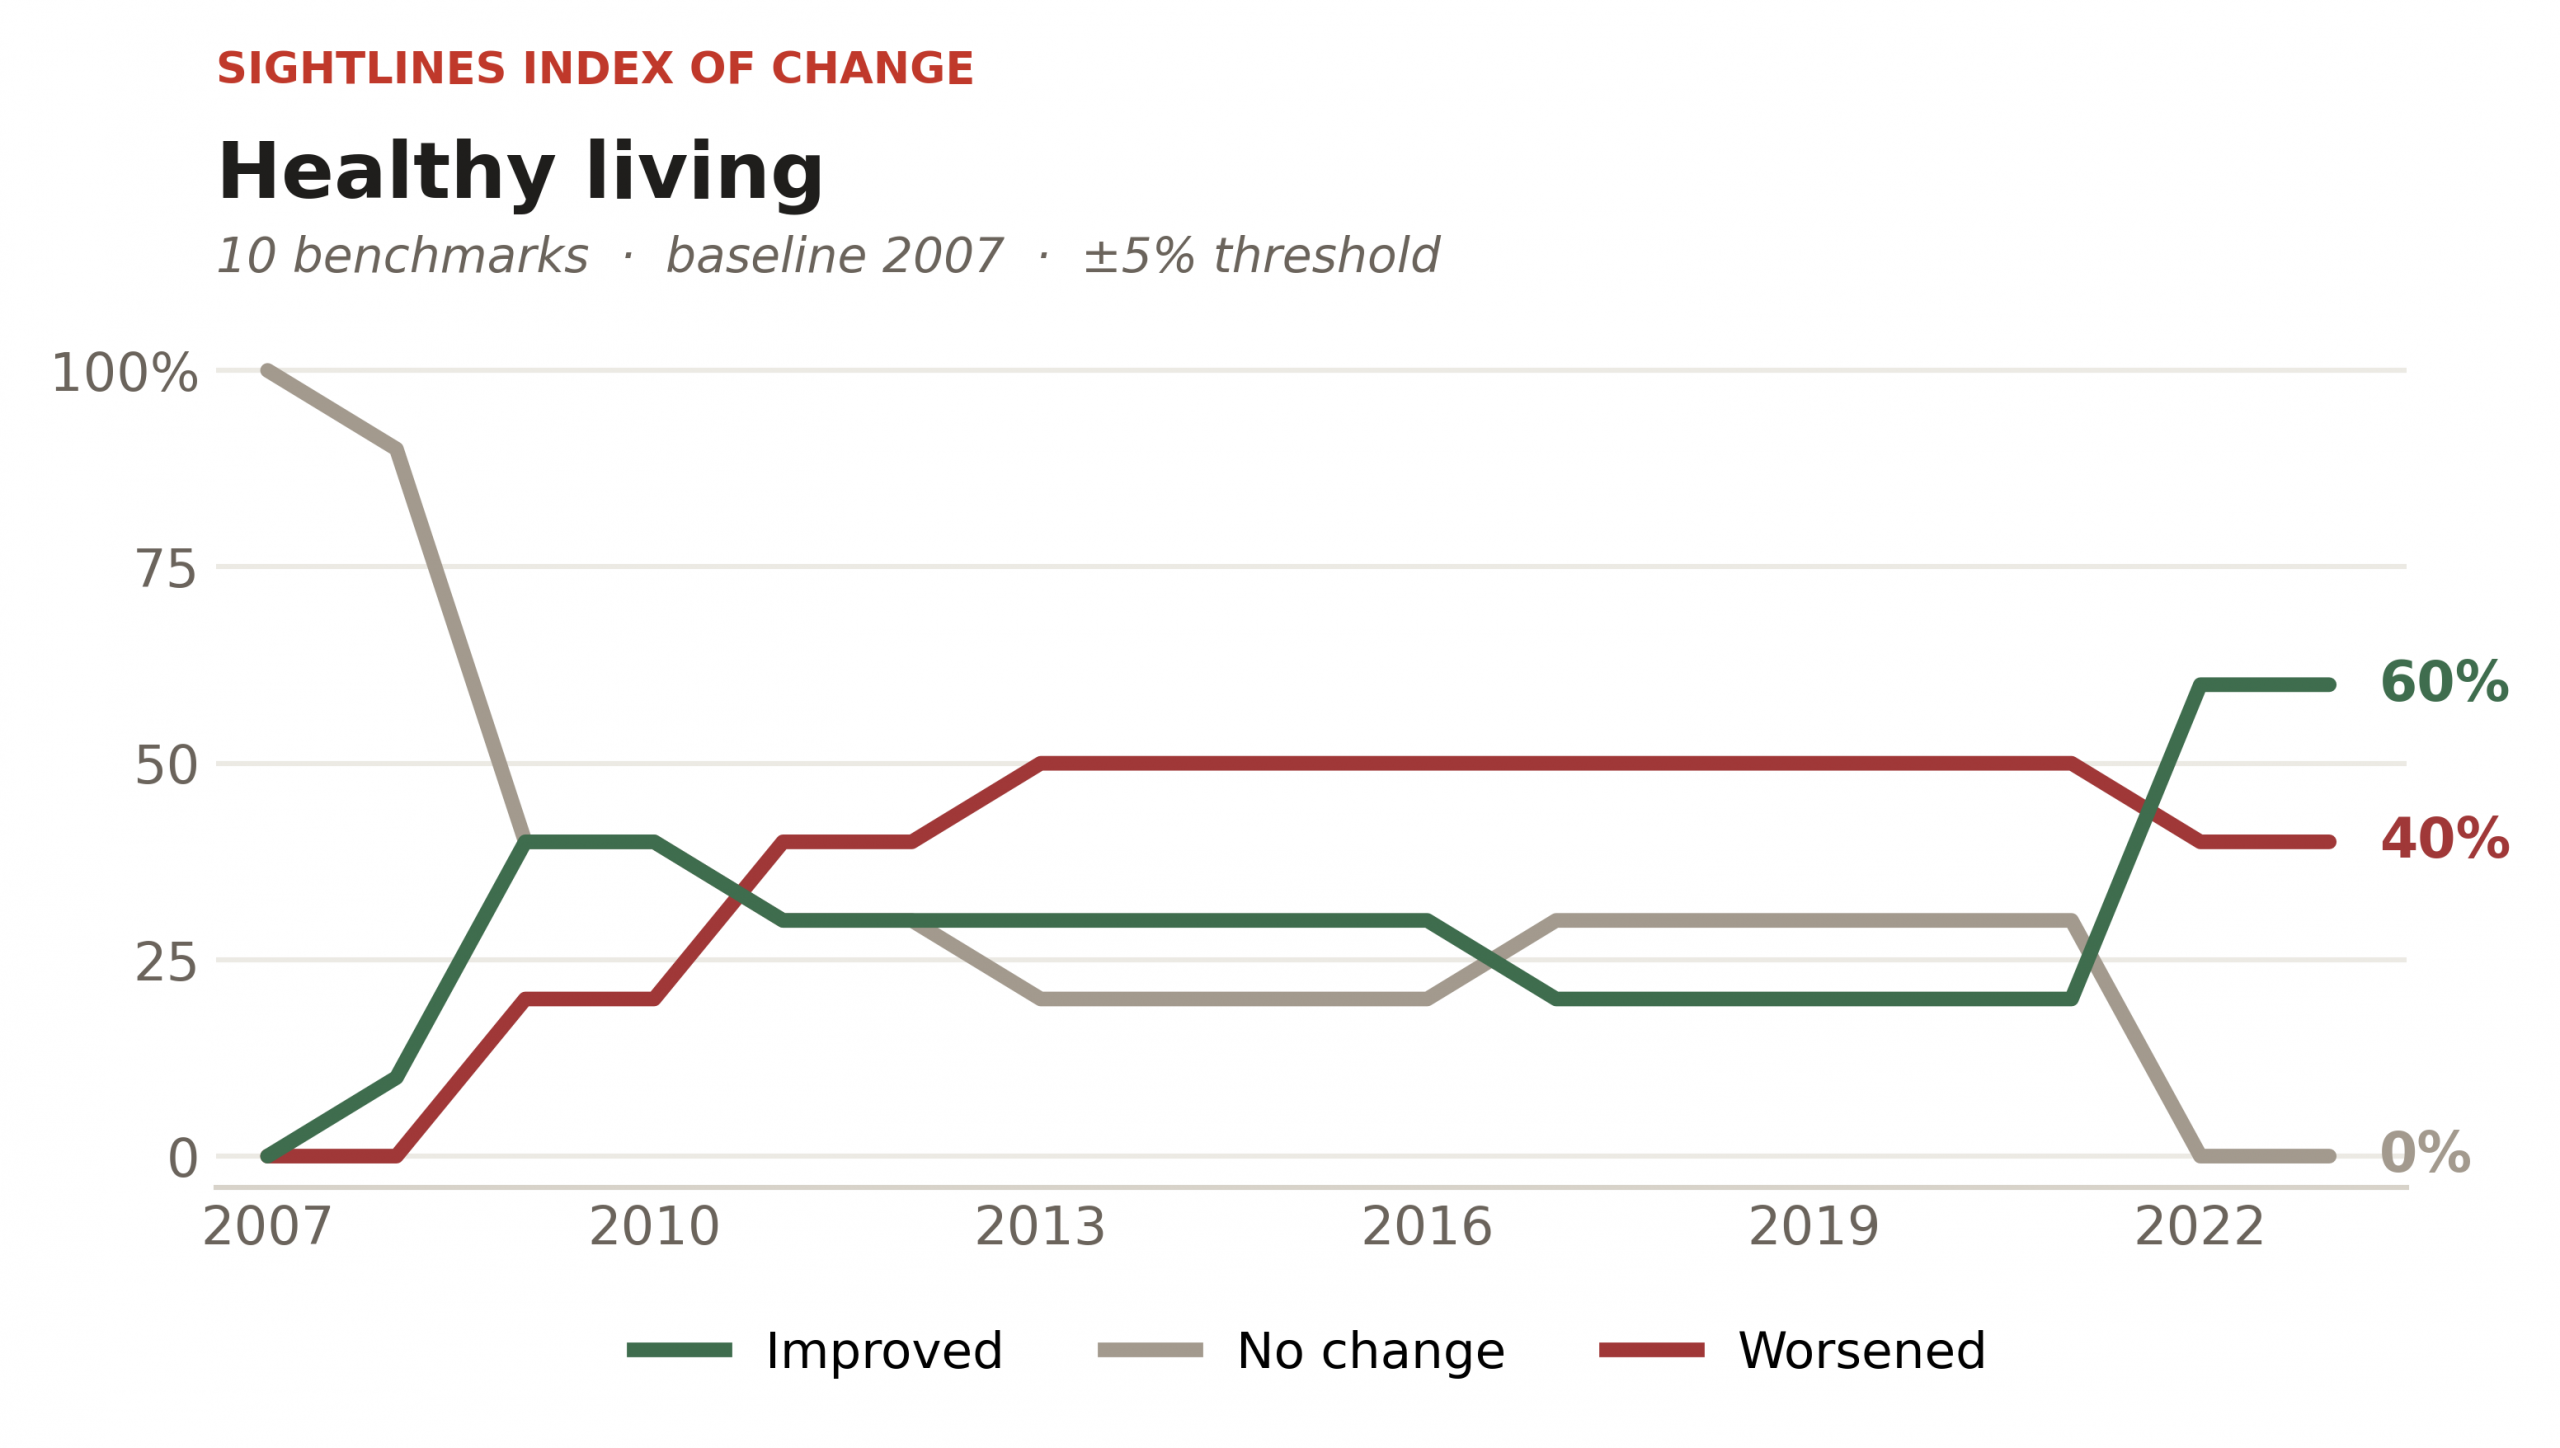
Healthy Living Domain

Tracks two sets of health behaviors fundamental to long and healthy lives: health-promoting behaviors and adverse health behaviors

9 BENCHMARKS

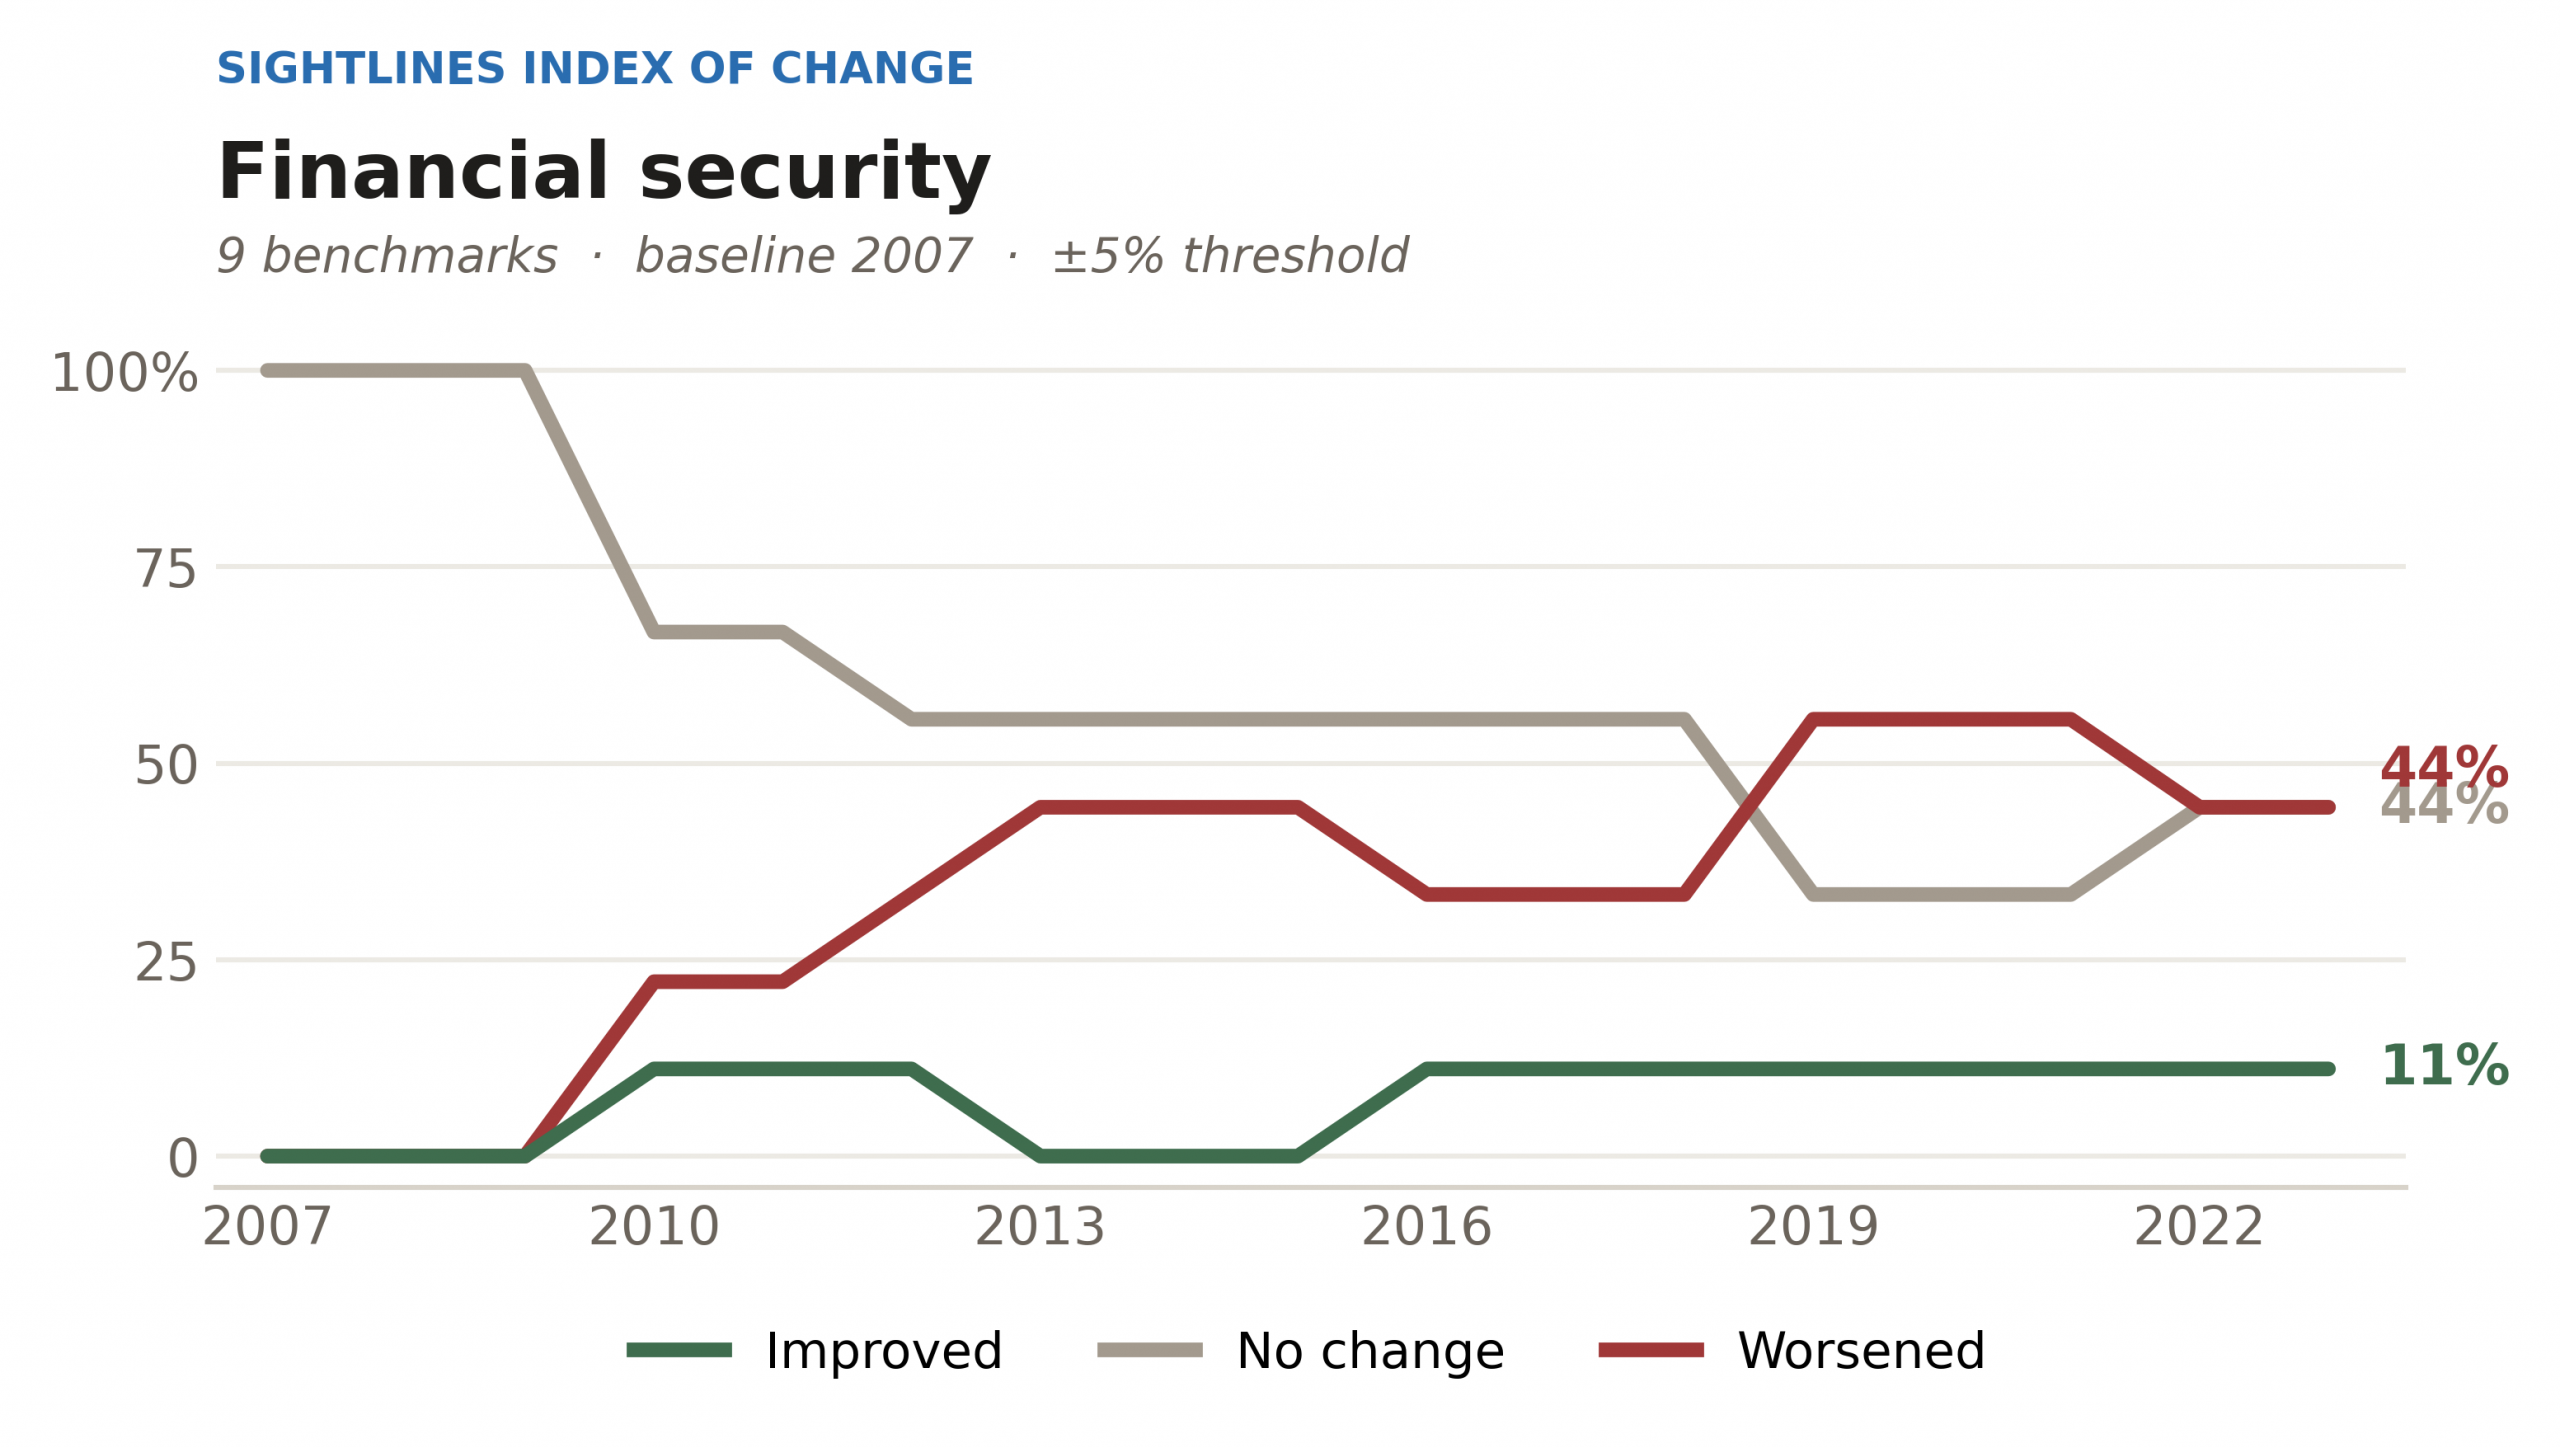
Financial Security Domain

Tracks benchmarks fundamental to long-term financial security, spanning insurance coverage, financial strain, and attainment of financial assets.

9 BENCHMARKS

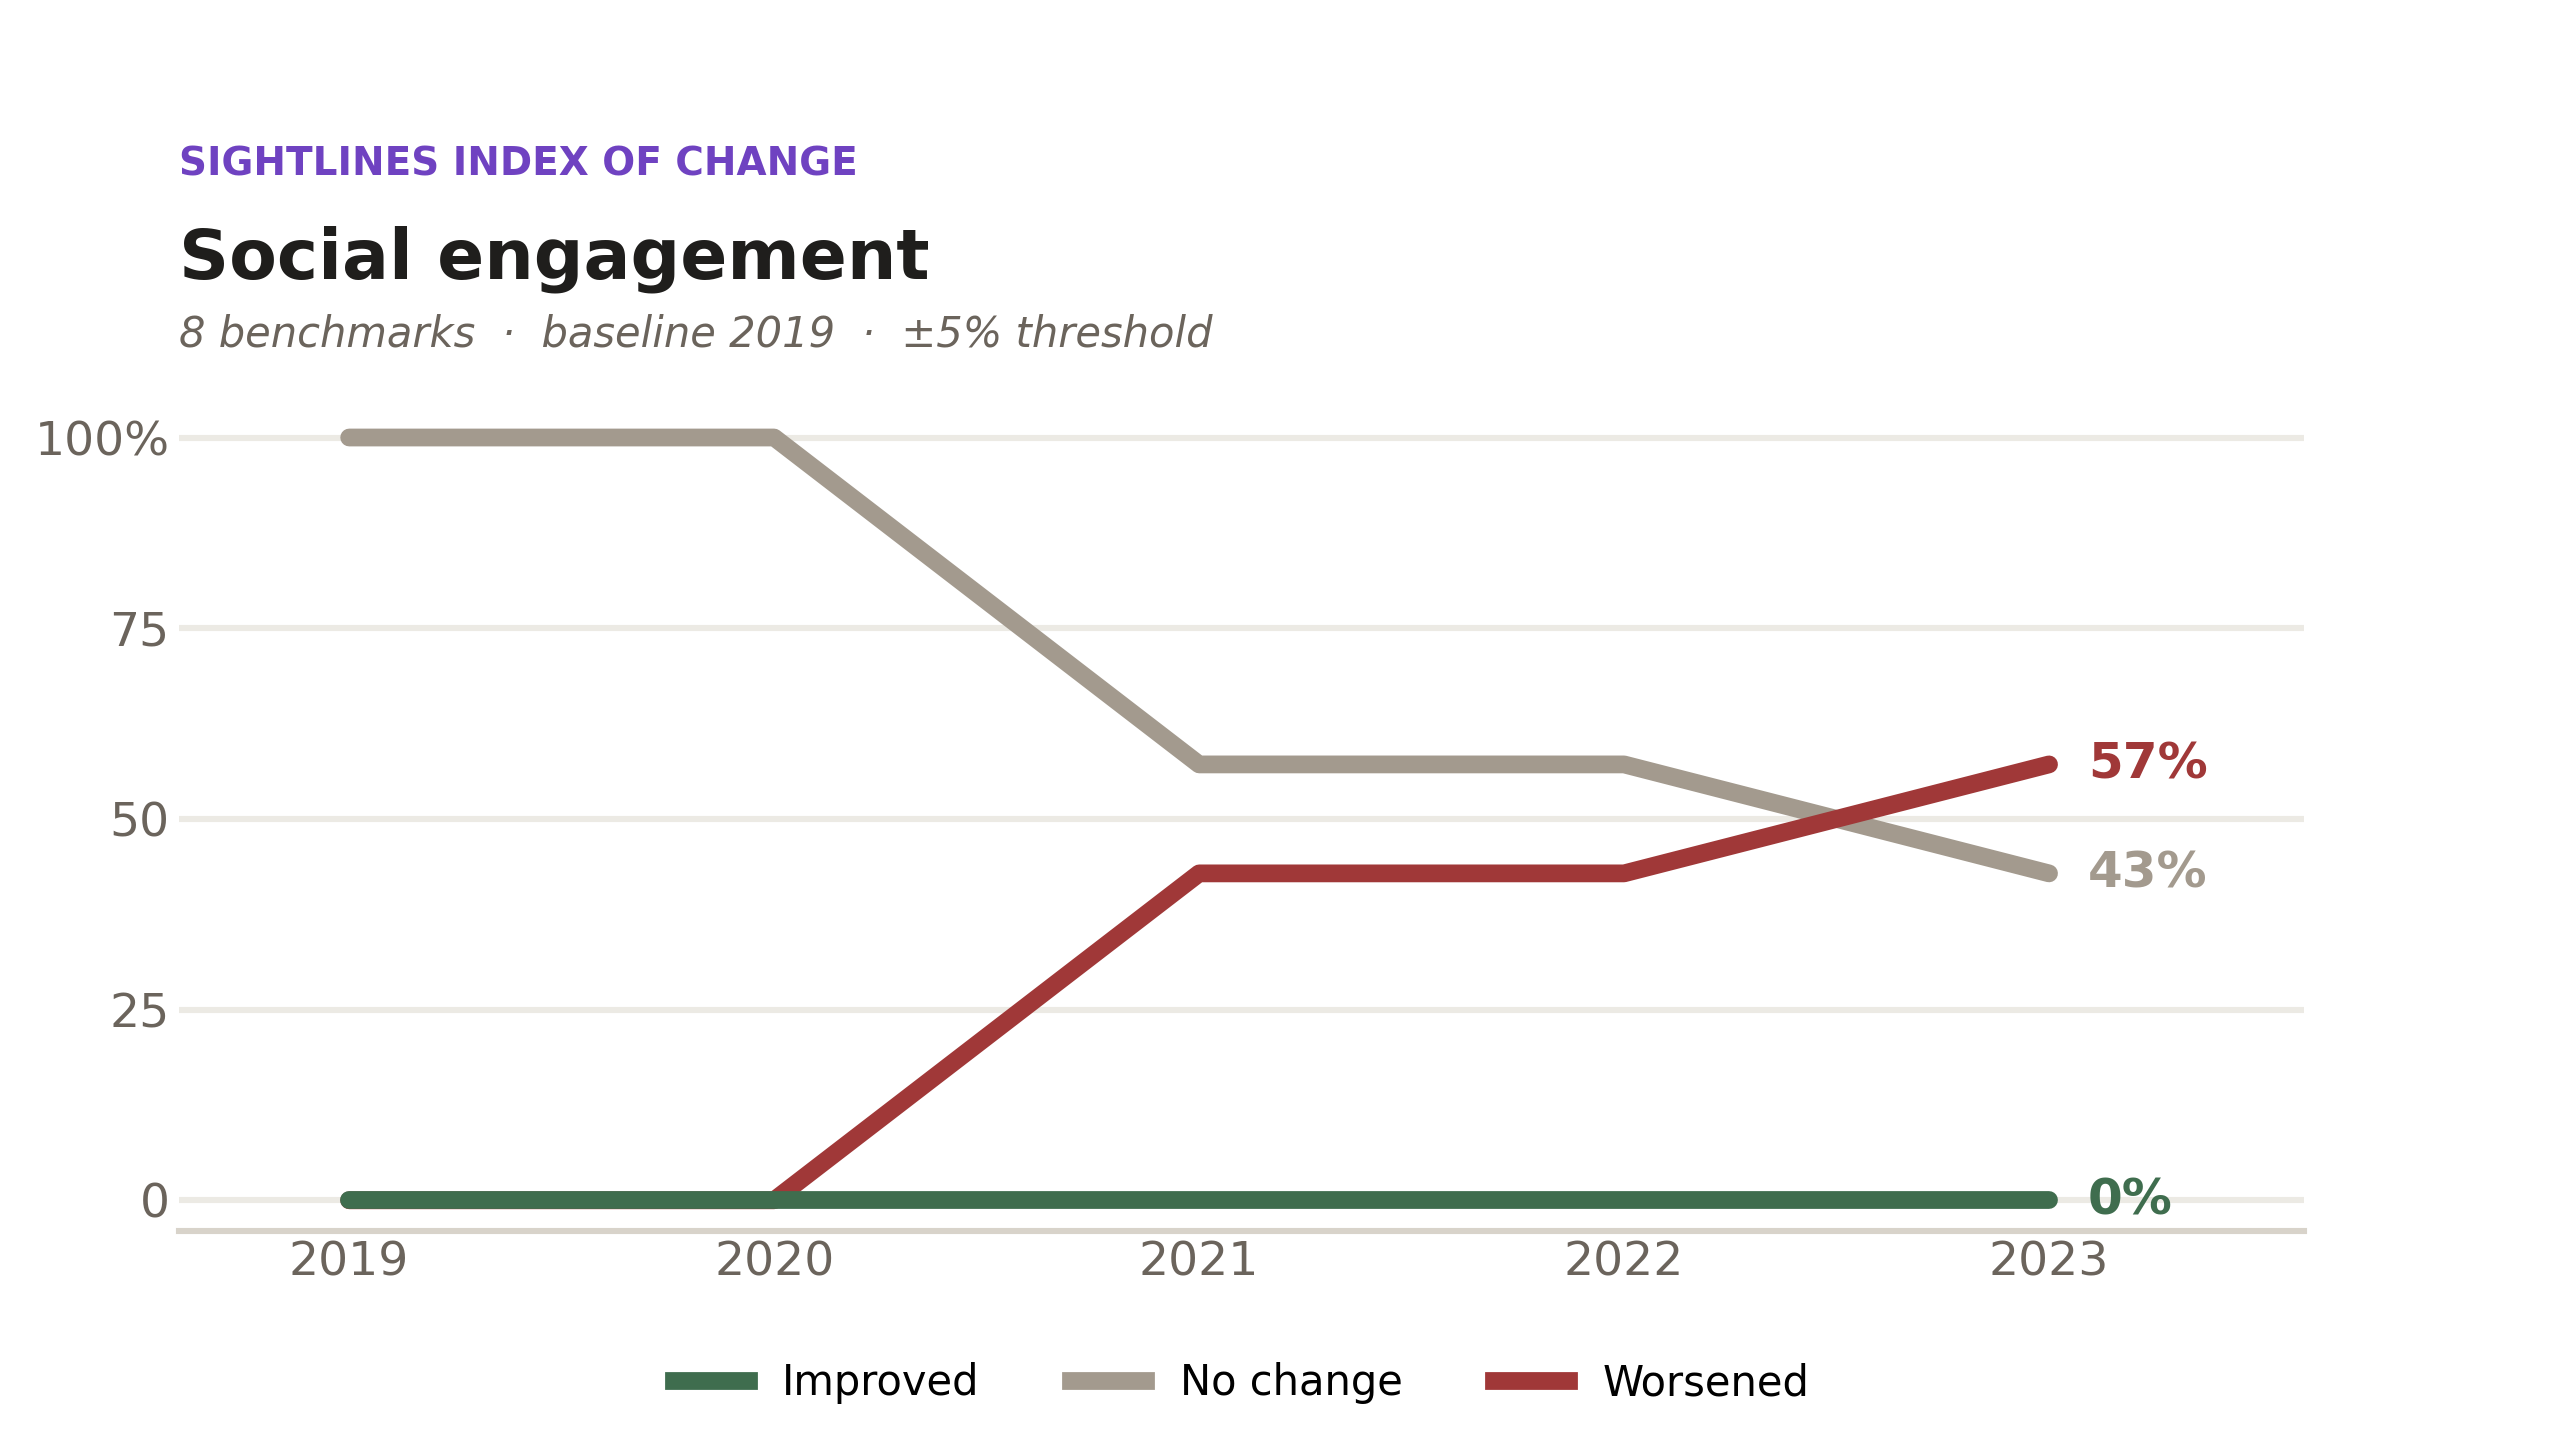
Social Wellbeing Domain

Tracks benchmarks fundamental to long-term social wellbeing: social connection, civic and community engagement, and mental health

FEATURED INSIGHTS

Explore key findings from the latest data.

33% relative decline in smoking

Adult smoking fell from 21.6% (1999) to 14.6% (2022), a 33% relative decline.

Explore the Smoking Benchmark →

15% drop in life insurance coverage

Life insurance coverage dropped from 68.2% (2004) to 58.0% (2022), down 15%.

Explore the Life Insurance Benchmark →

9 percentage point drop in home ownership

Home ownership rates dropped from 68.7% (2000) to 59% (2022), down 9 percentage points.

Explore the Home Ownership Benchmark →

15% relative increase in Americans with high bad mental health days.

Poor mental health days increased from 10.1% (2011) to 11.6% (2022), up 15%.

Explore the Poor Mental Health Days Benchmark →

Keep exploring

Poverty risk Chronic debt Emergency funds Investment accounts Retirement savings Home ownership Health insurance Long-term care insurance Life insurance
Exercise moderately High sedentary time Unhealthy BMI Eating fruits & vegetables Sufficient sleep Cigarette smoking Excessive alcohol use Illicit drug use Fast food consumption Ultra-processed foods
Friends and family interactions Neighbor interactions Helping neighbors Volunteering Workforce participation Lifelong learning Poor mental health days Anxiety Depression

© Copyright - Stanford Center on Longevity
  • Link to Youtube
  • Link to LinkedIn
Scroll to top Scroll to top Scroll to top