
Sightlines Project Special Report
SOCIAL ENGAGEMENT
CHAPTER 1: The Importance of Social Relationships for Longevity
Jialu L. Streeter, Sarah Raposo, and Hsiao-Wen Liao
Human and non-human primates are inherently social beings. From an evolutionary perspective, our very survival depends on strong attachments to caregivers. We are born preprogrammed to bond to others. Beyond protection and food, emotionally-strong relationships are intricately bound to social and cognitive development. Classic research by Harry Harlow [1] examined preferences in previously isolated infant monkeys for wire surrogates. Two surrogates were presented to the monkeys. One was simply a cold wire mesh figure. The other was identical except that the wire was covered with soft foam rubber and terry cloth. Even when the plain wire surrogate provided milk and the terry cloth surrogate did not, the babies preferred time with the latter. Other evidence about the importance of emotional comfort came from babies who were housed in orphanages after WWII. Their observed distress, listlessness, and emotional dampening led to the development of attachment theory [2,3,4]. More recently, Charles Nelson and colleagues documented differences between adopted and institutionalized Romanian orphans in a sobering controlled experiment. Children who had been living in orphanage from birth were randomly assigned to move into foster families or remained in care as usual. Even though all were well fed and cared for, the institutionalized children had lower cognitive performance, abnormal language development, and higher rates of attachment disorders [5, 6].
More recently, brain imaging has allowed for research that documents the primacy of social and emotional experience. Nancy Kanwisher and colleagues revealed a region of the brain dedicated solely to human face processing [7]. Functional imaging has shown that our brains respond in a similar fashion when socially excluded or rejected as when we experience physical pain [8,9,10]. Indeed, many believe that the human desire and need to interact with others and to understand complex social cues drove the expansion of the cortical mantle of the human brain [11,12].
The need for social connection does not fade with age. Social engagement and connectedness have profound implications for well-being, including a sense of security, self-esteem, physical, mental, and cognitive health, andoverall life satisfaction. Epidemiological studies of population-level trends find that individuals with few or low-quality social relationships have higher mortality rates even when their baseline health status is controlled for [13,14,15]. Feeling socially isolated is as great a risk factor for premature death as smoking a half a pack of cigarettes every day [16]. In today’s world, however, many Americans suffer from a lack of social connection. In fact, as many as “Sixty million Americans feel sufficiently isolated that it is a major source of unhappiness in their lives,” according to John Cacioppo and William Patrick in their book, Loneliness.
In this report, we begin by reviewing empirical findings about the ways in which social networks and social connectedness tends to change across the life span. Selected theories are provided to enhance the understanding on the observed trends and patterns. In Section Two, we discuss the influences of social engagement on physical, mental, and cognitive health, as well as overall wellbeing. In Section Three, we explore whether, and to what extent, social connectedness changes over time. In Section Four, we consider the circumstances where older adults suffer more than younger adults from a lack of social interaction.
“Money doesn’t contribute to the happiness of those above the poverty level. Instead, companionship – family solidarity, friendship, and social support is good for our wellbeing.”
Robert Lane, “The Loss of Happiness in Market Democracies”
1. Social Engagement: What Is It and What Do We Know?
In the research literature, three components of social relationships have been distinguished [17,18, Figure 1]. First, there are social networks, which are defined as the number of social relationships and associated roles, such as spouses, friends, and children, and the frequency of contacts with those relationships. Second, there is participation in social activities, such as involvement in social organizations, including activities in religious and non-religious groups and volunteer organizations. The final dimension is the quality of relationships, which includes positive and negative emotional aspects of relationships, such as comfort and conflict.
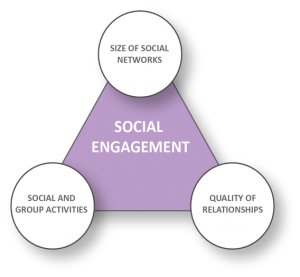
Figure 1: Illustration of Social Engagement
1.1 Patterns of Social Engagement over the Life Span
Over the Life Span, the Size of Social Networks First Increases and then Decreases; The Intensity of Social Contacts First Decreases and then Increases.
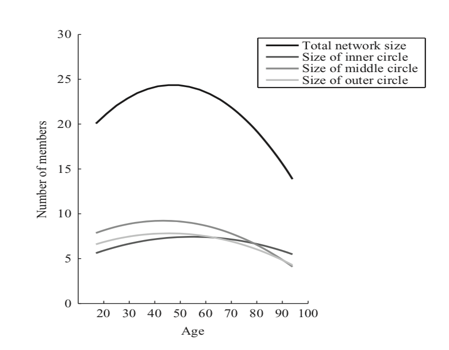
Figure 2: Age differences in social network size, overall and broken down by circle [19].
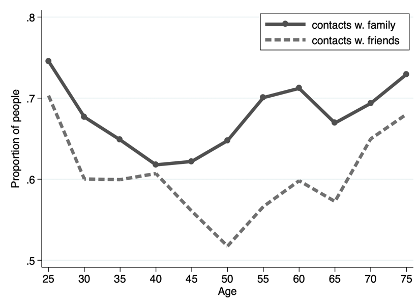
Figure 3: Whether one contacts friends or family members at least three times a week (MIDUS data, SCL 2019)
Over the course of our lives, the size of social networks first increases and then decreases, peaking at around age 40-50 (Figure 2). When young, people actively seek to expand their social connections, which may help enhance their opportunities in their career and life. As people get older, they begin to exhibit a stronger desire to seek meaning in their lives, the urgency of which is partly driven by their realization of the diminishing time left in their lives [20]. Older adults eliminate less-essential relationships and connections and focus more on relationships that bring more meaning and joy in a process known as “social network pruning.” Consequently, older people appear to have smaller but more emotionally rich social networks than younger people.
Thus, while the size of one’s network grows smaller, the depth and intensity of those relationships increases. Figure (2) illustrates the proportion of people in frequent contact with their friends and family members who do not live with them. Contact refers to face-to-face visits, phone calls, letters, or electronic messages. Almost mirroring Figure (2), the pattern of contact frequency in Figure (3) exhibits a clear “U” shape. About 75% of those in their late 20s to early 30s contact friends and family frequently. Between ages 30 and 50, the percentage of people in frequent contact declines with age. This reflects the fact that people may be busy with their work and their own family life, taking care of young children, and so forth. After age 50, people begin to reach out to friends and family again. During this time, their children are grown, their work may be wrapping up, and more time is available for them to make frequent contact again.
The Quality of Relationships with Family Members Improves with Age
Note: Both figures used the MIDUS data, calculated by SCL.
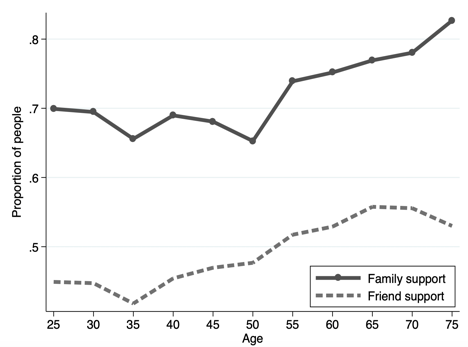
Figure 4: Proportion of people able to rely on family or friends “a lot” when facing a serious problem

Figure 5: Proportion of people reporting being understood “a lot”by others
Next, we examined the quality of social networks and relationships by age groups. Figure (4) shows the proportion of people who report being able to rely “a lot” on their social networks when facing a serious problem. Figure (5) shows the proportion of people who feel they are understood “a lot” by others. Compared to younger adults, older people appear to enjoy a higher quality of social relationships, especially with their family members.
In sum, Figures (2)-(5) suggest that aging is associated with fewer social connections, but more intense contact with the remaining core base of connections, and therefore with a higher quality of relationships. We will now turn to some theories that help explain the observed patterns.
1.2 The Theory Behind Social Engagement
Social Convoys: Those who accompany us in our journeys through life
The “Social Convoy Model” of relationships was developed by [21]. This model is vital to the general understanding of changes in social engagement over the life course. It highlights that the life circumstances and goals pursued at different life stages affect what people want from their social network and contacts. In other words, earlier life experience matters for one’s later social engagement.
Figure (6) illustrates an example of the Convoy Model. The center represents the individual, “Me.” The three larger circles represent that person’s convoy:
- The Inner Circle (1st tier): People who are very close to the focal person. They are perceived as critical support givers. Membership in this inner circle is relatively stable throughout life. For example, a close friend who now lives far away may remain in the inner circle.
- The Middle Circle (2nd tier): Often family, friends, or co-workers. Compared to those in the 1st tier, the focal person perceives support from 2nd tier members as more relevant on the roles that they fill in his or her life. A person’s relationship with his or her 2nd tier contacts may be less stable over the life course than those within the 1st tier, as many environmental changes may affect the nature of their relationships. An example could be mothers whose children went to the same school for 6 years who may become close, but the relationship changes after their children go to different schools later.
- The Outer Circle (3rd tier): People who are least close to the focal person, but have nevertheless been identified as sources of support. Compared to the 1st and 2nd tiers, the interactions between the focal person and the 3rd tier members are even more dependent on each member’s role. Examples include co-workers, supervisors, and neighbors.

Figure 6: The Social Convoy Model [21]
Socioemotional Selectivity Theory: Those Who Make Us Happy and Appreciate Life
As shown in Figure (2), the size of social networks continues to change across the life span. Specifically, social networks increase in size in young adulthood and then steadily decline throughout later life. In particular, peripheral ties are reduced in older adulthood [22,23,24]. This trend is also exhibited in digital interactions; older adults’ Facebook networks are smaller than those of younger adults, but they contain higher percentage of actual friends [25]. But what are the catalysts for the decrease in size of the social networks?
Older adults do indeed lose some of those closest to them for customary reasons, but these age-related losses may not fully account for the systematic changes in the size of social networks across the life span. Carstensen and colleagues suggest that, for the most part, older people’s smaller social networks are not a result of an uncontrollable loss of close ties, but rather a selective “pruning” process that involves dropping peripheral relationships that are less personally and emotionally meaningful while retaining relationships that provide satisfaction. Their assumption is based on Socioemotional Selectivity Theory (SST), which maintains that individuals’ motivational shifts from seeking novelty and information in younger adulthood to the pursuit of emotionally meaningful experiences in older adulthood is a function of perceived time left in life [20, 26]. Younger people tend to see vast futures, and so prioritize forging new bonds, seeking new information, and exploration in preparation for these futures [23, 27]. As people age, they see time as increasingly limited and prioritize emotionally meaningful experiences that help to savor the moment. In seeking emotionally meaningful experiences, older adults are motivated to spend time with, and maintain close ties to, people who matter, close relatives and friends, and to let go of social ties that fail to confer satisfaction and meet these needs (e.g., acquaintances). In other words, people construct a social environment that serves their needs [28]. Empirical research supports this theory since social selection has been observed to correlate with better daily emotional experience [19]. As peripheral social contacts are dropped and as close ones are maintained in later life, older people reported being more satisfied with their smaller network size [23,29].
Social Network Clustering: Who We Know Determines What We Do
The two models above both examined social relationships from an individual perspective. A different approach would be to understand the structure and interconnectedness of social networks. Nicholas Christakis at Yale University view social networks as clusters of relationships that are ubiquitous, intricate, and complex. These broad sets of connections can be used to improve our understanding of collective behaviors and phenomena such as emotions, risky behaviors, and crimes. For example, Christakis and colleagues found that a person’s risk of obesity rises by 45% when his or her friends are obese. One explanation for this is the confounding effect, which describes when a group of people have something in common (e.g., an oversaturation of fast food restaurants nearby or a lack of a neighborhood gym), and in turn explains this clustering phenomenon. Similarly, such confounding factors may help explain why we observe clusters with high saturations of other health and social behaviors, such as smoking, drinking, altruism, and other health and social behaviors.
A person’s position within a social cluster may be partly attributable to their idiosyncratic features (e.g., introverted vs. extraverted), but such positions are also dynamic over time as they enter different stages in life. Connected in various ways to other people in the same cluster, we are influenced not only by our close contacts but also by relatively remote, indirect connections, such as friends of friends of friends
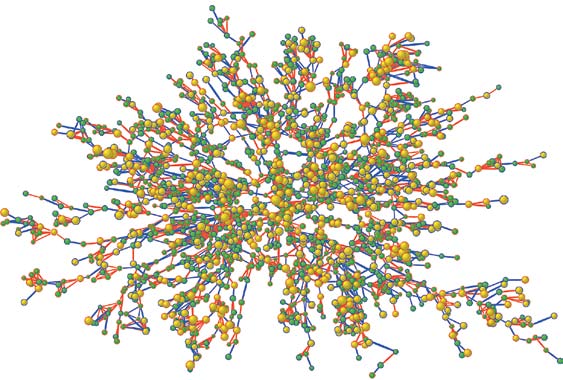
Figure 7: An illustration of a social network [30]. Red: female, blue: male. Yellow: BMI>30. Node size is proportional to BMI. Arrow colors indicate relationship. Purple: friend or spouse, orange: biological kin.
2. Strong Social Ties Help Enhance Physical Health, Cognitive Health, and Overall Life Satisfaction
In general, having strong social ties can have a powerful effect on people’s well-being, including physical, mental, and cognitive health [15]. Below, we summarize the relationship between social engagement and each of the other health domains.
Physical Health. A lack of social ties, in the form of objective social isolation, subjective feelings of loneliness, or low quality of social relationships, has been found to be a risk factor causing poor physical health [17, 31-35], including higher prevalence of disease [36] and increased likelihood of mortality [13, 37, 38].
Various study designs and techniques have been used to examine the relationship between social ties and physical health. Some of these studies are longitudinal, which help confirm that the relationship between social relationships and mortality rates is independent of baseline health and socioeconomic status. These findings have been strengthened in subsequent meta-analyses. Holt-Lunstad and colleagues, for example, conducted a meta-analysis which reviewed 148 studies covering over 300,000 participants and found that the influence of social relationships on the risk of mortality is comparable with risk factors such as smoking and alcohol consumption. It also exceeds the influence of other risk factors such as physical inactivity and obesity.
Mental and Cognitive Health. For older adults, being socially engaged is associated with mental and cognitive benefits, although most studies are correlational and not causational. For example, feelings of loneliness have been linked to depression [39], and having frequent social interactions combined with a more extensive social network has also been found to protect against cognitive decline [40,41]. It remains unclear whether problems precede declining engagement or result from it.
The technical challenge of identifying causality may lie in the fact that additional variables that cannot be easily observed or tested (e.g., genetic traits and personality) are causing both social isolation and cognitive decline [42-46]. The 2006 study conducted by Bennett and colleagues [47] is one of the few studies that provides causal evidence on the protective mechanism of social networks on cognitive decline. Among older adults who shared the same Alzheimer’s disease pathology, those with a bigger social network showed lower impairment in cognitive function. A more extensive social network, as Bennett and colleagues suggested, may enhance older adults’ ability to tolerate the pathology of Alzheimer’s disease and exhibit less obvious clinical symptoms.
A critical factor is that the associations between social engagement and well-being are dependent on the quality of the social ties: as beneficial as positive relationships can be to health, negative relationships can be just as detrimental [48,49].
How Social Contacts and Relationships Influence Our Wellbeing
Having seen ample evidence that supports the association between satisfying social connections and health outcomes, researchers have been motivated to further explore exactly how and why social relationships affect our health. According to Cohen and colleagues [36,50], social contacts affect people in two ways:
- Social support buffers negative effects of stress. For people suffering from stress, social support can provide a buffer to individuals from its effects, thereby protecting their physical health. This social support can come in the form of instrumental help (e.g., lending money, caregiving, comforting conversations/reassurance) or the belief that their social network will provide high levels of support if needed.
- Social integration promotes positive psychological states. This can include positive identity, purpose, self-worth, and positive affect, which induce health-promoting physiological responses. When exposed to cold viruses, people who were more socially integrated (i.e., married, had children and other family members, had friends and acquaintances or participated in social or community activities) were about 40% less likely to develop a cold.
Even though analyzing the specific impacts of social engagement on wellbeing is still an ongoing academic pursuit, most people can at least broadly identify that social engagement is a critical part of their lives. The WELL for Life [51] research group at Stanford University, led by Catherine Heaney, investigates the ways that people characterize what the word wellness means to them. They asked study participants to “think about a period of time when you experienced high or low well-being.” The responses were then grouped into several categories, including social connectedness, lifestyle behaviors, physical health, and stress & resilience (Figure 8). Nearly every participant – 97% to be exact – mentioned social connections and how their social relationships have affected their quality of life. Social connectedness is recognized by most people as a pivotal contributor to overall life satisfaction, more critical than other significant factors such as material status and physical health.
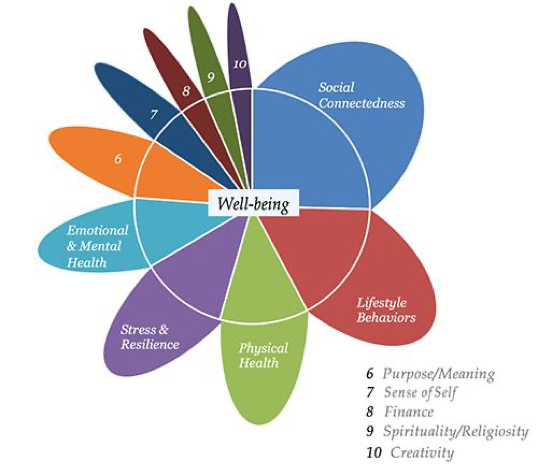
Figure 8: Well Flower by Well for Life project [51]. A high percentage of participants consider social connections as important to their overall well-being.
3. How do Social Networks Change Over Time?
It is clear from the research discussed so far that social networks change over a person’s life span, with networks becoming smaller but relationships becoming closer. In addition to this age effect at the individual level, is there a cohort effect at the generational level? In other words, are Americans today more or less socially engaged than their counterparts several decades ago?
This is not a question with simple answers. Communication technology has evolved rapidly in just the last few decades, profoundly affecting the ways in which we connect with others. In the following section, we examine how social engagement has changed over time in two steps. First, we consider trends in how social connections, measured in the “conventional,” pre-social media modes, have changed over time. Second, we discuss whether virtual communication, such as the use of social media, confers the same benefits as in-person interactions.
Staying connected face to face. Existing research suggests that Americans’ social interactions, measured by conventionalmethods of social engagement such as church-going, community outreach, and dinner parties, are on the decline. Robert Putnam warned in his book, “Bowling Alone: The Collapse and Revival of American Community,” that our stock of social capital – the very fabric of our connections with each other, has plummeted, which in turn, impoverishes our lives and communities [52]. Based on nearly half a million interviews over 25 years, his investigation indicates that Americans sign fewer petitions, belong to fewer organizations that meet in-person, are less acquainted with neighbors, meet with friends less frequently, and even socialize with family less often.
Declining social capital over the last 25 years:
Attend club meetings: 58% drop
Family dinners: 43% drop
Having friends over: 35% drop
Source: Putnam (2001)
Findings from the Stanford Center on Longevity’s Sightlines Project are consistent with Putnam’s observations. The Sightlines project uses data from the Midlife in the United States (MIDUS) study to examine the proportion of Americans engaged in social activities and whether this proportion has changed over time. As shown in Figure (9), the proportions of Americans socializing with their neighbors or attending religious services have both fallen significantly over two decades and across all ages.
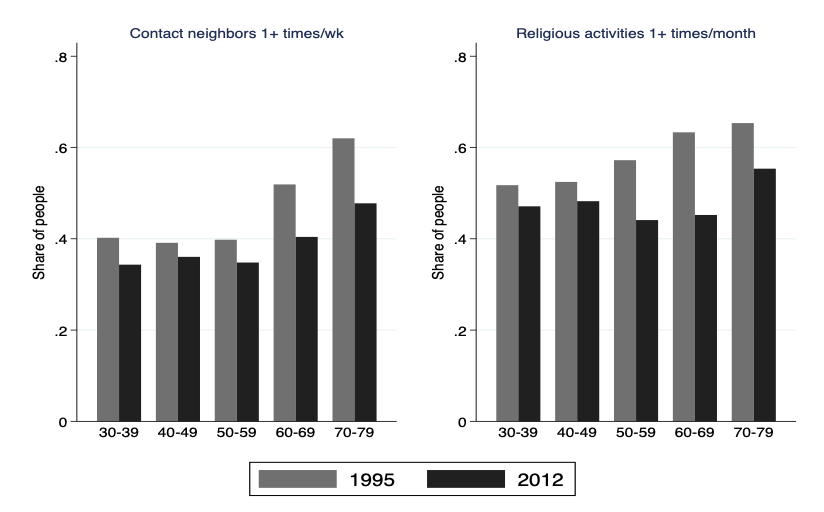
Figure 9: The percentages of people contacting neighbors and attending religious activities are declining over time (the Sightlines Project [53], MIDUS data)
Staying virtually connected. Given that the conventional forms of social interactions are declining, are newer forms of connection compensating? Tools such as the internet, smartphones, and social media have introduced fundamentally different ways for us to stay connected with our family, friends, and the global community. These advancements, however, have only become widely used in the last two decades. After all, Facebook was founded only 15 years ago, and the first iPhone was introduced just 12 years ago. As a result of these technological advancements, is the world more or less connected than before? Because this is such an important and growing area of research, we plan to devote a separate report to the impact social technologies have on our lives and wellbeing, and only touch on some key findings here.
Public opinion is sharply divided regarding the effects of these technologies, and on social media in particular. When asked, “Is your loneliness made better or worse by social media?” about the same percentage of social media users responded “better” as those who responded “worse” [54].
Research on the impact of social media on social connectedness has not reached a consensus, either. Because the history of social media is so short, most studies are correlational in nature, which makes it difficult to identify any causal relationship. Moreover, the data samples are unbalanced with a heavy emphasis on the young, who tend to use social media at much higher rates and with much higher frequency than older adults.
Some research suggests that the use of social media is associated with greater social capital benefits, especially for college-age users experiencing low self-esteem and low life satisfaction [55]. Other studies find that social media users who consume greater levels of content report reduced social capital and increased loneliness [56]. Using experience sampling in which researchers text-messaged participants five times per day for two weeks to track their subjective wellbeing, Kross and colleagues [57] revealed that Facebook use predicts negative shifts over time on both moment-to-moment feelings and an overall satisfaction. The more a person used Facebook, the worse he or she felt the next time someone text-messaged them. Not surprisingly, the more they used Facebook over the entire two weeks, the more their life satisfaction levels declined over time. Interacting with other people face-to-face did not predict these negative outcomes.
In the future, more longitudinal data and randomized tests will help us better understand whether virtual communication substitutes for in-person conversations, and to what extent the use of social media introduces beneficial and adverse effects into our lives.
Is there a loneliness epidemic?
 Headlines are abundant: Americans are facing a loneliness epidemic. This may be cause for great alarm, but there is reason to step back and consider whether this really is an epidemic. Here are some important points to consider:
- What is being assessed: Loneliness is the subjective sense of feeling alone. This is different from social isolation, which is the objective measurement of having few social contacts or few social interactions. Although related, they are exclusive: people can feel lonely even when with many others or feel supported even if they have few close friends. These differences can have powerful effects on the individual.
- The role of age: Loneliness severity and age have a complex relationship, with average feelings of loneliness fluctuating across the life span. People typically experience increases in loneliness in their late-20s, mid-50s, and late-80s [58].
- Today, one in ten Americans always feel alone, and over a third said they sometimes feel alone [16].
- The role of technology: People have different opinions about whether social media contributes to loneliness. About 30% of study respondents said social media has made things better, whereas another 30% said it has made things worse [54]. Similarly, a Cigna study on loneliness in the
- U.S. found social media use alone does not predict a higher level of loneliness.
- Researchers found that loneliness has declined among American high school and college students over time [59], although social isolation has increased over time.
In short, we cannot say if there is an epidemic, because loneliness has not been measured well historically. On the upside, the fact that researchers today are measuring loneliness more systematically, and trying to figure out how to do it well, suggests there is more attention being paid to loneliness now than there was previously. Hopefully this increase in attention and the improvements in measurement will help to accurately track levels of loneliness going forward and help researchers better address overall well-being.
4. As We Age, Connections Remain as Important as Ever
It is clear from the research discussed so far that social networks change over a person’s life span, with networks becoming smaller but relationships becoming closer. In addition to this age effect at the individual level, is there a cohort effect at the generational level? In other words, are Americans today more or less socially engaged than their counterparts several decades ago?
This is not a question with simple answers. Communication technology has evolved rapidly in just the last few decades, profoundly affecting the ways in which we connect with others. In the following section, we examine how social engagement has changed over time in two steps. First, we consider trends in how social connections, measured in the “conventional,” pre-social media modes, have changed over time. Second, we discuss whether virtual communication, such as the use of social media, confers the same benefits as in-person interactions.
Staying connected face to face. Existing research suggests that Americans’ social interactions, measured by conventionalmethods of social engagement such as church-going, community outreach, and dinner parties, are on the decline. Robert Putnam warned in his book, “Bowling Alone: The Collapse and Revival of American Community,” that our stock of social capital – the very fabric of our connections with each other, has plummeted, which in turn, impoverishes our lives and communities [52]. Based on nearly half a million interviews over 25 years, his investigation indicates that Americans sign fewer petitions, belong to fewer organizations that meet in-person, are less acquainted with neighbors, meet with friends less frequently, and even socialize with family less often.
Older adults are often more effective at achieving emotional regulation than younger adults, but according to Charles’s Strength and Vulnerability Integration model [60], older adults’ emotional outcomes are still dependent upon the situations in which they find themselves. When there are no constraints, older adults in general are better than younger people at constructing social environments that they enjoy and attending to positive relative to negative information. Such a developmental strength of socioemotional selection contributes to everyday emotional experiences [61]. When older adults are able to realize their preferred goals, they fare better than younger adults, which is consistent with findings that show older adults usually report more frequent positive emotions than negative [62]. Based on the observations that older age is often associated with poorer physiological tolerance of stress, situations where older people are exposed to sustained negative events and cannot proactively control their environments, some research suggests that older adults may experience difficulty returning to some state of equilibrium [60].
A common characteristic of situations that may prevent older adults from regulating their emotions is lack of personal control. Examples of chronic, uncontrollable situations may include the loss of a spouse or partner, living in poverty, living with an abusive spouse, living with a functionally limiting and deteriorating health condition or taking care of a family member with a severe, chronic condition. A group of researchers at Stanford University aimed to investigate the wellbeing of older versus younger adults who were providing care for a relative in an effort called “The Comfort Keepers Project.” This project, conducted in collaboration with ClearCare, a homecare software company, found that in general, older family caregivers reported better emotional wellbeing (positive emotions relative to negative over the past week) compared to younger family caregivers. This is consistent with previous findings in non-caregivers [62,63]. However, when older family caregivers were supporting a relative with a severe illness, they did not experience the same age-related benefits in emotional wellbeing as their peers caring for a relative with even a mild illness. These findings held even after controlling for the family caregiver’s gender, socioeconomic status, health, whether they were working for pay, and whether they were living with their relative. Findings also indicated that older caregivers caring for a severely ill relative had more difficulty with their social relationships relative to those caring for a mildly ill relative. Taken together, these findings are consistent with the SAVI model: when older family caregivers were in a challenging situation, their emotional wellbeing declined at least in part because it limited their ability to foster other meaningful relationships.
Cigna US Loneliness Index
The Cigna study surveyed more than 20,000 US adults 18 years and older to examine loneliness in America.
Main findings:
- Gen Z and Millennials are lonelier than older generations.
- Social media use alone is not a predictor of loneliness.
- Students have higher loneliness scores than retirees.
- No significant differences are found between gender and races regarding loneliness scores.
- Individuals less lonely are more likely to be in better physical and mental health, with a balanced daily activity.
Comfort Keepers

Older adults tend to report being happier and more satisfied than younger adults, which may be attributable to their ability to prioritize meaningful relationships. But what happens in a situation in which an older person cannot prioritize meaningful relationships in ways they want?
In late 2016, our research group conducted a survey of family caregivers to understand the role social relationships play in younger and older adults’ emotional wellbeing; specifically, they examined the frequency of positive emotions they felt in the past week (e.g., happiness, joy, calm) relative to negative emotions (e.g., angry, sad, frustrated).
The group reasoned that family caregivers would vary in the amount of constraint in their lives. Consequently, caring for a severely ill loved one would constrain individuals’ social lives more than if caring for a mildly ill loved one, and that this constraint would affect older adults’ emotional wellbeing more than that of younger adults.
On average, older family caregivers reported better emotional wellbeing than younger family caregivers. This is consistent with previous findings in non-caregivers [62,63].
Importantly, older family caregivers who were caring for a severely ill relative reported more difficulty spending time with friends and family and worse emotional wellbeing than their peers caring for a mildly ill relative. These findings suggest that situations that hinder people’s ability to spend time with others they care about, in ways they care about, may be particularly detrimental to older adults’ well-being.
Conclusions
Humans are intrinsically social. At every life stage, we make new connections and keep or eliminate older ones. As such, the inner, middle, and outer circles of our contacts remain dynamic over the life span. At the individual level, aging is associated with fewer peripheral contacts who matter the least to our happiness, but with more frequent interactions with our core base of friends and family. Relationship quality also improves with age, possibly because we prune social networks such that only the most meaningful are retained. Across generations, there appears to be a decline in people’s overall level of social connections. People are less socially engaged today than in the past – as measured by the conventional, pre-social media modes of interactions.
Despite the decrease in the levels of in-person social connections, research also reminds us that social engagement is a multi-faceted rather than a single dimension concept. It is inadequate, for example, to merely use the number of friends to judge whether a person has sufficient social connections. While older people have fewer close relationships than the younger ones, they report higher satisfaction with social ties. In this vein, perhaps the decrease in face-to-face connections reflects a natural progression corresponding to various aspects of societal change and advancement, such as the changing family structure (e.g., the shift from multi-generation families to nuclear families), the increased mobility of the labor force that has resulted in family and friends moving away, and the potentially different landscape in religious beliefs and ways of practicing worship, and the evolution of technology and increased use of digital tools such as social media. Research is underway to identify reasons behind the decline in social interactions across generations and the role that online social networking platforms play – some of which will be addressed in a subsequent special issue on social technology.
With increased life expectancy, the prevalence in education, and advancement in social technologies, we are hopeful that individuals today can make better use of the new platforms, to enhance their experience in connecting with family, friends, and communities. We look forward to fruitful studies that capture nuanced and novel ways of social engagement that help people achieve their desire of being loved and giving love.
References
[1] Harlow, H. F. & Zimmermann, R. R. (1958). The development of affective responsiveness in infant monkeys. Proceedings of the American Philosophical Society, 102,501 -509.
[2] Bowlby, J., and Robertson, J. (1952). A two-year-old goes to hospital. Proceedings of the Royal Society of Medicine, 46, 425–427.
[3] Bowlby, J. (1958). The nature of the child’s tie to his mother. International Journal of Psychoanalysis, 39, 350-371.
[4] Bowlby J. (1969). Attachment. Attachment and loss: Vol. 1. Loss. New York: Basic Books.
[5] Nelson, C.A., Zeanah, C.H., Dox, N.A., Marshall, P.J., Smyke, A.T., Guthrie, D. (2007). Cognitive recovery in socially deprived young children: the Bucharest Early Intervention Project. Science, Dec 21; 318(5858).
[6] Nelson, C. A., Fox, N. A., & Zeanah, C. H. (2014). Romania’s Abandoned Children: Deprivation, Brain Development, and the Struggle for Recovery. Cambridge, MA: Harvard University Press. https://doi.org/10.4159/harvard.9780674726079
[7] Kanwisher N, McDermott J, Chun MM (Jun 1, 1997). “The fusiform face area: a module in human extrastriate cortex specialized for face perception”. J. Neurosci. 17 (11): 4302–11. doi:10.1523/JNEUROSCI.17-11-04302.1997. PMID 9151747.
[8] Eisenberger, N., Lieberman, M., Williams, K. (2003). Does rejection hurt? An fMRI study of social exclusion. Science. Vol 302
[9] Eisenberger, N., and Lieberman, M. (2004). Why rejection hurts: a common neural alarm system for physical and social pain. Trends in Cognitive Sciences, Vol. 8, No. 7.
[10] MacDonald, G., & Leary, M. R. (2005). Why does social exclusion hurt? The relationship between social and physical pain. Psychological bulletin, 131(2), 202.
[11] Dunbar, R.I.M., and Shultz, S. (2007). Evolution and the social brain. Science, 317:1344-47.
[12] Cacioppo, J.T., and Patrick, W. (2008). “Loneliness: Human Nature and the Need for Social Connection.” W.W., Norton and Company, Inc.
[13] Berkman, L.F., and Syme, L., , Social networks, host resistance, and mortality: a nine-year follow-up study of alameda county residents, American Journal of Epidemiology, Volume 109, Issue 2, February 1979, Pages 186–204, https://doi.org/10.1093/oxfordjournals.aje.a112674
[14] Berkman LF, Leo-Summers L, Horwitz RI. Emotional Support and Survival after Myocardial Infarction: A Prospective, Population-based Study of the Elderly. Ann Intern Med. 1992;117:1003–1009. doi: 10.7326/0003-4819-117-12-1003
[15] Berkman, L. F., Glass, T., Brissette, I., and Seeman, T. (2000). From social integration to health: Durkheim in the new millennium. Social Science & Medicine., Vol 51, Issue 6.
[16] Cigna. (2018). “Cigna US Loneliness Index.” https://www.multivu.com/players/English/8294451-cigna-us-loneliness-survey/docs/IndexReport_1524069371598-173525450.pdf
[17] House, J, Landis, K., Umberson, D. (1988). Social relationships and health. Science, New Series, Vol. 241, No. 4865.
[18] Brissette, I., Cohen, S., & Seeman, T. E. (2000). Measuring social integration and social networks. In S. Cohen, L. Underwood, & B. Gottlieb (Eds.), Measuring and intervening in social support (pp. 53–85). New York: Oxford University Press.
[19] English, T., and Carstensen, L.L. (2014). “Selective narrowing of social network across adulthood is associated with improved emotional experience in daily life.” International Journal of Behavior Development 2014. Vol. 38(2).
[20] Carstensen, L. L. (2006). The influence of a sense of time on human development. Science, 312(5782), 1913–1915. https://doi.org/10.1126/science.1127488
[21] Kahn, R.L. & Antonucci, T.C. (1980) Convoys over the Life Course: Attachment, Roles, and Social Support. In: Baltes, P.B. and Grim, O.G., Eds., Life Span Development and Behavior, Vol. 3, Academic Press, New York, 253-286.
[22] Ainsworth, M. S. (1979). Infant–mother attachment. American Psychologist, 34(10), 932-937. http://dx.doi.org/10.1037/0003-066X.34.10.932
[23] Fung, H. H., Carstensen, L. L., & Lang, F. R. (2001). Age-Related Patterns in Social Networks among European Americans and African Americans: Implications for Socioemotional Selectivity across the Life Span. The International Journal of Aging and Human Development, 52(3), 185–206. https://doi.org/10.2190/1ABL-9BE5-M0X2-LR9V
[24] Wrzus, C., Hänel, M., Wagner, J., & Neyer, F. J. (2013). Social network changes and life events across the life span: A meta-analysis. Psychological Bulletin, 139(1), 53-80.
http://dx.doi.org/10.1037/a0028601
[25] Chang, P. F., Choi, Y. H., Bazarova, N. N., & Löckenhoff, C. E. (2015). Age Differences in Online Social Networking: Extending Socioemotional Selectivity Theory to Social Network Sites. Journal of Broadcasting and Electronic Media, 59(2), 221–239. https://doi.org/10.1080/08838151.2015.1029126
[26] Carstensen, L.L., Issacowitz, D.M., and Charles, S.T. (1999). Taking time seriously: a theory of socioemotional selectivity. American Psychologist, Vol. 54, Issue 3.
[27] Lang, F. R., & Carstensen, L. L. (2002). Time counts: Future time perspective, goals, and social relationships. Psychology and Aging, 17(1), 125-139.
[28] Carstensen, L. L., Pasupathi, M., Mayr, U., & Nesselroade, J. (2000). Emotion experience in the daily lives of older and younger adults. Journal of Personality and Social Psychology, 79, 1-12.
[29] Fung, H. H., Stoeber, F. S., Yeung, D. Y. L., & Lang, F. R. (2008). Cultural specificity of socioemotional selectivity: Age differences in social network composition among Germans and Hong Kong Chinese. The Journals of Gerontology Series B: Psychological Sciences and Social Sciences, 63(3), P156-P164.
[30] Smith, K. P., & Christakis, N. A. (2008). Social networks and health. Annu. Rev. Sociol, 34, 405-429.
[31] Uchino, B. N., Cacioppo, J. T., & Kiecolt-Glaser, J. K. (1996). The relationship between social support and physiological processes: A review with emphasis on underlying mechanisms and implications for health. Psychological Bulletin, 119, 488–531.
[32] Cohen, S., Gottlieb, B., & Underwood, L. (2000). Social relationships and health. In S. Cohen, L. Underwood, & B. Gottlieb (Eds.), Measuring and intervening in social support (pp. 3–25). New York: Oxford University Press.
[33] Kiecolt-Glaser, J. K., & Newton, T. L. (2001). Marriage and health: His and hers. Psychological Bulletin, 127, 472–503.
[34] Cornwell, E. Y., & Waite, L. J. (2009). Social Disconnectedness, Perceived Isolation, and Health among Older Adults. Journal of Health and Social Behavior, 50(1), 31–48. https://doi.org/10.1177/002214650905000103
[35] Coyle, C. E., & Dugan, E. (2012). Social Isolation, Loneliness and Health Among Older Adults. Journal of Aging and Health, 24(8), 1346–1363. https://doi.org/10.1177/0898264312460275
[36] Cohen, S., Doyle, W. J., Skoner, D. P., Rabin, B. S., & Gwaltney, J. M., Jr. (1997). Social ties and susceptibility to the common cold. Journal of the American Medical Association, 277, 1940–1944.
[37] Holt-Lunstad J, Smith TB, Layton JB (2010) Social Relationships and Mortality Risk: A Meta-analytic Review. PLoS Med 7(7): e1000316. https://doi.org/10.1371/journal.pmed.1000316
[38] Holt-Lunstad, J., Smith, T. B., Baker, M., Harris, T., & Stephenson, D. (2015). Loneliness and Social Isolation as Risk Factors for Mortality: A Meta-Analytic Review. Perspectives on Psychological Science, 10(2), 227–237. https://doi.org/10.1177/1745691614568352
[39] Luo, Y., Hawkley, L. C., Waite, L. J., & Cacioppo, J. T. (2012). Loneliness, health, and mortality in old age: a national longitudinal study. Social science & medicine, 74(6), 907-914.
[40] Holtzman, R. E., Rebok, G. W., Saczynski, J. S., Kouzis, A. C., Doyle, K. W., & Eaton, W. W. (2004). Social Network Characteristics and Cognition in Middle-Aged and Older Adults. The Journals of Gerontology: Series B, 59(6). doi:10.1093/geronb/59.6.p278
[41] Thomas, P. (2011). Trajectories of Social Engagement and Limitations in Late Life. Journal of Health and Social Behavior, 52(4), 430-443. Retrieved from http://www.jstor.org/stable/23113189
[42] Barnes LL, Mendes de Leon CF, Wilson RS, Bienias JL, Evans DA. Social resources and cognitive decline in a population of older African Americans and whites. Neurology 2004; 63: 2322–26.
[43] Bassuk SS, Glass TA, Berkman LF. Social disengagement and incident cognitive decline in community-dwelling elderly persons.Ann Intern Med 1999; 131: 165–73.
[44] Fratiglioni L, Wang HX, Ericsson K, Maytan M, Winblad B. Influence of social network on occurrence of dementia: acommunity-based longitudinal study. Lancet 2000; 355: 1315–19.
[45] Seeman TE, Lusignolo TM, Albert M, Berkman L. Social relationships, social support, and patterns of cognitive aging in healthy, high-functioning older adults: MacArthur studies of successful aging. Health Psychol 2001; 20: 243–55.
[46] Wilson RS, Krueger KR, Arnold SE, et al. Loneliness and Risk of Alzheimer Disease. Arch Gen Psychiatry.2007;64(2):234–240. doi:10.1001/archpsyc.64.2.234
[47] Bennett, D. A., Schneider, J. A., Tang, Y., Arnold, S. E., & Wilson, R. S. (2006). The effect of social networks on the relation between Alzheimer’s disease pathology and level of cognitive function in old people: a longitudinal cohort study. The Lancet Neurology, 5(5), 406-412.
[48] Seeman, T. E. (1996). Social ties and health: The benefits of social integration. Annals of epidemiology, 6(5), 442-451.
[49] Umberson, D., & Karas Montez, J. (2010). Social relationships and health: A flashpoint for health policy. Journal of health and social behavior, 51(1_suppl), S54-S66.
[50] Cohen, S. (2004). Social Relationships and Health. American Psychologist, 59(8), 676-684. http://dx.doi.org/10.1037/0003-066X.59.8.676
[51] Well for Life Study. Stanford University School of Medicine. https://med.stanford.edu/wellforlife.html
[52] Putnam, R. D. (2001). Bowling alone: The collapse and revival of American community. New York: Simon & Schuster.
[53] The Sightlines Project. Stanford Center on Longevity. Stanford University. https://longevity.stanford.edu/the-sightlines-project/
[54] Kaiser Family Foundation (2018). “Loneliness and social isolation in the United States, the United Kingdom, and Japan: an international survey.” https://www.kff.org/report-section/loneliness-and-social-isolation-in-the-united-states-the-united-kingdom-and-japan-an-international-survey-section-2/
[55] Ellison, N. B., Steinfield, C. and Lampe, C. (2007), The Benefits of Facebook “Friends:” Social Capital and College Students’ Use of Online Social Network Sites. Journal of Computer‐Mediated Communication, 12: 1143-1168. doi:10.1111/j.1083-6101.2007.00367.x
[56] Burke, M., Marlow, C., and Lento, T. (2010). Social network activity and social well-being. Proceeding of the SIGCHI conference on Human Factors in Computing Systems. https://dl.acm.org/citation.cfm?id=1753613
[57] Kross E, Verduyn P, Demiralp E, Park J, Lee DS, Lin N, et al. (2013) Facebook Use Predicts Declines in Subjective Well-Being in Young Adults. PLoS ONE 8(8): e69841. https://doi.org/10.1371/journal.pone.0069841
[58] Lee, E., Depp, C., Palmer, B., Glorioso, D., Daly, R., Liu, J., . . . Jeste, D. (n.d.). High prevalence and adverse health effects of loneliness in community-dwelling adults across the life span: Role of wisdom as a protective factor. International Psychogeriatrics, 1-16. doi:10.1017/S1041610218002120
[59] Clark, D. M. T., Loxton, N. J., & Tobin, S. J. (2015). Declining Loneliness Over Time: Evidence From American Colleges and High Schools. Personality and Social Psychology Bulletin, 41(1), 78–89. https://doi.org/10.1177/0146167214557007
[60] Charles, S.T., (2011). Strength and vulnerability integration (SAVI): a model of emotional well-being across adulthood. Psychol Bull. Nov: 136(6):1068-1091.
[61] Sims, T., Hogan, C., & Carstensen, L. (2015). Selectivity as an Emotion Regulation Strategy: Lessons from Older Adults. Current opinion in psychology, 3, 80–84. doi:10.1016/j.copsyc.2015.02.012
[62] Carstensen, L. L., Turan, B., Scheibe, S., Ram, N., Ersner-Hershfield, H., Samanez-Larkin, G. R., … Nesselroade, J. R. (2011). Emotional experience improves with age: Evidence based on over 10 years of experience sampling. Psychology and Aging, 26(1), 21–33. https://doi.org/10.1037/a0021285
[63] Charles, S. T., Reynolds, C. A., & Gatz, M. (2001). Age-Related Differences and Change in Positive and Negative Affect Over 23 Years, 80(1), 136–151.
Chapter 2. Assessing Social Engagement in the Age of Social Technology
Marie Conley Smith, Social Science Research Professional
Introduction
Scientific studies have shown that people have a natural desire to maintain connections with others, and a strong, supportive social network is beneficial to physical and mental health. However, since the mid-twentieth century, traditional forms of social engagement have declined in the United States: people are interacting with their communities, including neighbors, church congregations, and civic organizations, less frequently now than two decades ago [1,2]. At the same time, a digital revolution has taken place, which has ushered in technologies that introduce both new forms of social engagement and new ways for scientists to accurately quantify people’s social activities, interactions, and behaviors.
These advances in technology have increased our ability to tackle complex research questions that traditional methods have been unable to fully answer. For example, some researchers have used smartphones to measure how long people remain on different social media platforms and how frequently they switch between them in order to gain a better understanding of people’s social lives. Other researchers have used machine learning techniques to interpret language used on social media platforms to predict health and behavioral outcomes. It is not yet understood whether the recent explosion of virtual interactions might cause or accelerate the decline of in-person connections, or if people can receive a similar, or even increased amount of satisfaction and health benefits from new, virtual modes of social engagement.
This report highlights some of the most novel and useful methods developed for examining different facets of Social Engagement. Part 1 focuses on methodologies for assessing social engagement at the individual level, including experience sampling, building a “Screenome,” and using a lexical approach. Part 2 focuses on methodologies at the community and societal level, including analyzing social networks as clusters, using Google street view to assess neighborhoods and communities, and using a lexical approach for entire regions.
Methods for assessing social engagement at the individual level
Experience sampling: A barometer of our daily feelings
Observing and measuring individuals’ emotional responses to daily experiences in a rigorous way has long been a challenge for social scientists. Bringing people into a laboratory setting, while useful in many contexts, disrupts daily life and places people in an unfamiliar setting. This can reduce the ecological validity of a study, which refers to how similar the study setting is to that of the real-world setting that the researchers are interested in. Study sessions conducted in laboratory settings also may not capture a complete picture of individuals’ emotional experiences, which often fluctuate throughout a given day or week. To overcome these obstacles, researchers are taking advantage of new technologies to more reliably and completely capture people’s emotions and experiences in their daily settings.
One of the first such efforts is the Experience Sampling Method (ESM), which was initially created in the late 1970s [3] and continues to be used today. ESM involves a researcher alerting participants at random times throughout the day (e.g., with a beeper or other paging device). At each of these time points, the participants provide immediate responses to questions about their current context and how they are feeling in that moment (see Figure 1 for an example of an experience sampling questionnaire). In order to explore whether emotional experience changes with age, Carstensen and colleagues [4] combined ESM with a longitudinal design. They alerted participants five times per day over one week to gather rich emotional experience data, then repeated this experience sampling five and ten years later, also for one week each. The researchers found that older age is associated with greater emotional well-being and emotional stability.

Figure 1: Emotional experience questionnaire5. Participants rate their feeling of 19 emotions on a 7-point scale, partly seen here. The list of emotions included 8 positive emotions (e.g., pride, happiness) and 11 negative emotions (e.g., anger, guilt).
English and Carstensen [6] later used the data captured in the Carstensen et al. [4] study (described previously) to examine how people’s emotional experiences might be affected by their social connections. The researchers used the daily experience sampling data to calculate, on average, how positive and negative a person felt in a week. They then analyzed this emotion data with data from a social network assessment that had been collected once during each wave for information about the composition of each person’s social network and whether the participant associated positive or negative emotions with each social connection. The researchers found that the emotions associated with people’s social connections influenced their daily emotional well-being, particularly if the connections were associated with negative emotions.
A modified version of ESM – the Day Reconstruction Method (DRM) – was later developed by Kahneman and colleagues [7] in attempt to minimize the potentially disruptive effect of frequent alerts. The DRM approach asks participants are to reconstruct the previous day by breaking it into structured “episodes” (e.g., “commuting to work,” and “at lunch”). Similar to experience sampling, participants then answer questions about the context of each episode and how they felt during it. Building the context around each episode helps increase the accuracy of participants’ recall of recent memories. This method is less expensive than ESM and does not disturb daily activities. One study used DRM to explore why extraverts are more likely to feel positive affect than introverts [8]. While other methods tend to conflate extraversion and global positive affect, the DRM approach allowed the researchers to separate these two constructs by using a global measure of extraversion and episodic measures of positive affect, thus avoiding overlap and providing richer data. They found that extraverts and introverts enjoy social interactions to a similar extent, but extraverts are more likely to interact with others more frequently, which helps explain why they experience greater positivity.
The administration of experience sampling and similar methods has become simpler and more practical thanks to the ubiquity of smartphones. While previous experience sampling researchers alerted participants using pagers and phone calls, these alerts and questionnaires can now be pushed directly to participants’ smartphones, which makes real-time data collection considerably easier and more efficient. Smartphones can also be used to collect and store the large volumes of data that are typically collected in ESM and DSM research. For example, in another study, researchers wanted to find out how often older adults reminisce in a conversation [9]. However, traditional self-report methods presented challenges, as many people were unaware of when they were reminiscing and others could not accurately recall when they reminisced. The methodological solution was to have participants carry a smartphone with recording software that would randomly record 30 seconds of their speech throughout the day. With this sporadic sampling, the researchers were able to obtain a much more accurate measurement of how often people were exhibiting this reminiscing behavior and with which social partners, and how reminiscing was related to well-being.
Screenomics: Capturing a digital footprint
Much of daily life now revolves around using social technology. It is so ubiquitous that instead of simply asking if people use technology, researchers now employ methods that allow them to measure how people are using it. Byron Reeves, Nilam Ram, and colleagues have developed a new method for examining the conscious and unconscious choices people make and the patterns they create as they switch between texting, email, social media, and other apps on their devices. Their approach involves building what they call a “Screenome” [10].
To build a Screenome, the researchers install an app on participants’ smartphones or computers that takes screenshots of their activities on the device every five seconds that the device is in use throughout the duration of the study. This is similar to the Experience Sampling Method in that it captures snapshots of an individual’s activity, but the advantage of this approach is that it does not rely on participants to provide responses. The Screenome is a powerful tool for investigating many aspects of the way people use technology across multiple platforms. This level of detail being measured in real time had, until now, been difficult to capture in social technology research.
In one example of the Screenome method, Reeves et al. examined the way a cohabiting couple interacted with each other and with their friends and families online [10]. Figure 2 shows each partner’s social media use on two different devices across 29 hours. Person A can be seen switching quickly between social media apps in the evening on their laptop, while Person B uses social media on their phone more sporadically throughout the night. This type of data can be broken down further to examine other patterns, such as which platforms they used with which social partners (e.g., one of the partners switched between several different platforms but only used one platform to communicate with family).
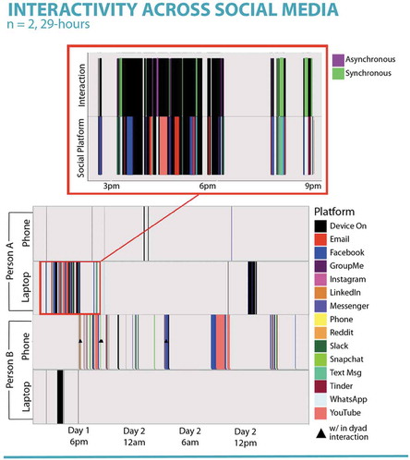
Figure 2: A cohabiting couple’s social media use across 29 hours10. The color bars represent use of a social media platform, the black bars represent time that the device was on but a social media platform was not being used, and the gray space indicates when the device was not in use. The upper panel magnifies a 3-hour time period for Person A’s social media use and shows whether communications or exchanges with another person were synchronous (i.e., communicating at the same time) or asynchronous (i.e., time elapsed between messages or they were switching between different tasks).
Digital lexical: Predicting individual outcomes from social media posts
The words people say and write can reveal rich information about their thoughts, feelings, beliefs, and relationships. Without asking direct questions, researchers can listen to someone’s conversation or read a sample of their writing to gain a better understanding of that person and how they interact with others. This “lexical” approach involves identifying key words and counting the frequencies of those words in a person’s text or speech, while considering the circumstantial information surrounding those words.
In a classic study, Walter Weintraub [11] noted that first-person pronouns such as I, me, and my were used much more frequently by people suffering from depression than by a control group. He also applied this method to news conferences with U.S. presidents to analyze their personalities and speaking styles [12]. These early studies were an accomplishment not only because of the ideas and findings they contributed to the field, but because they were done before technology was sufficiently powerful to automate the process (e.g., the researchers often counted words by hand).
The lexical approach has since become widely popular thanks to the increasingly fast speed of computer processors and improved storage capacity. During the time the technology was being developed, researchers also took many years to reach a consensus about which words and other aspects of language are most indicative of the psychological states they were trying to measure [13]. In the 1990s, all of these factors came together in a text analysis computer application called Linguistic Inquiry and Word Count (LIWC) [14], which was developed by researchers at the University of Texas at Austin.
This natural language processing software categorizes words and phrases according to an extensive dictionary that the researchers developed; for example, the words “buddy” and “pal” are categorized under “friend.” These predefined categories can be used to examine variables of interest. For example, researchers were interested in whether the language a couple used with each other was associated with the quality of their relationship [15]. They used LIWC to scan compilations of heterosexual couples’ instant messages and calculate the percentage of words that fit into categories such as “positive emotion” and “negative emotion.” They then analyzed this linguistic data alongside a separately collected survey about relationship quality. Their findings included: men’s use of “positive emotion” words (e.g., “nice,” “happy”) was positively associated with relationship satisfaction for both themselves and their partner, while women’s use of “positive negation” words (e.g., “not nice,” “not happy”) was negatively associated with relationship satisfaction for both themselves and their partner.
In this age of social technology, the amount of written content available for lexical analysis has skyrocketed as people are producing massive amounts of content online. In addition to the previous example involving instant messages, lexical software has been applied to social networking sites to make health predictions about individuals. Such prediction models incorporate the text of the posts, post length, posting frequency and timing, and demographic information. By applying these models on Facebook, Eichstaedt and colleagues were able to accurately predict depression three months prior to an official medical diagnosis [16]. This new application offers promising pathways to detect health-related conditions such as depression or loneliness, which are often underdiagnosed and undertreated.
Virtual reality: Inducing empathy with technology

Virtual reality is a rapidly developing technology for which researchers have already found many applications. It has been used to help children get vaccinated less fearfully, train soldiers for duty more safely, and bring people to faraway places they might not otherwise get to experience. It can also be used to convincingly put someone in another person’s shoes and to increase prosocial behavior.
VR has been shown to be highly effective at inducing empathy in individuals, and the effects last longer than traditional methods for inducing empathy. These effects were demonstrated in studies by Herrera, Bailenson, and colleagues [17], in which some participants experienced a sequence of events as a homeless person in VR, and others were asked to read a written account of what it is like to become homeless and imagine it happening to them. While participants in both conditions reported feeling more empathetic toward homeless people, participants who experienced homelessness through VR were more likely to sign a petition in favor of initiatives that would be helpful to homeless people. By expanding on this type of research, VR may be used to break down social barriers and reduce discrimination, paving the way for more inclusive communities.
Methods for assessing social engagement at the community level
We have highlighted methods that enable researchers to examine an individual’s social experiences. Now we turn to a few models that can be used to map larger-scale social networks and how people’s connections and behaviors may impact those around them.
Social network clustering: How behavior spreads through social connections
Social scientists have examined the architecture of social networks and their changes over time to understand how various collective phenomena, such as happiness, obesity, crimes, and divorce, spread through a network. Nicholas Christakis and James Fowler, for example, created visualizations of clusters of social connections, depicting how many connections people have, where they are located in the given social network (e.g., centrally or on the periphery), and how these connections evolve over time [18].
Previous studies have shown that these network characteristics can influence how quickly individuals experience a collective phenomenon, such as an infectious disease, such that centrally located individuals are likely to be infected earlier than more peripheral network members [19,20]. Individuals are considered to be more central to a network when they have a higher number of connections than others in the network and when they lie a shorter number of steps away from all other individuals in the network. Identifying and tracking these more central individuals, as opposed to observing more peripheral network members, can assist in early detection of the spread of a phenomenon. However, it can be quite expensive and impractical to map out an entire social network in order to find the centrally located individuals.
Christakis and Fowler tested a solution to this logistical challenge in a 2009 study of Harvard College undergraduates [21]. The researchers invoked the “friendship paradox,” which is the phenomenon that, on average, an individual’s friends have more friends than they do [22]. This would indicate that the friend of a randomly selected individual would tend to be more central to a social network than the randomly selected individual. The researchers tested this idea by recruiting a random group of students and having them each nominate a friend for participation. The researchers then monitored both the randomly selected individuals and their nominated friends during an H1N1 flu outbreak. Christakis and Fowler found that the nominated friends were infected with the flu virus an average of 16 days before the rest of their network (Figure 3). This indicates that monitoring nominated friends, as opposed to mapping out an entire social network and monitoring those located most centrally, is still effective for early detection of a phenomenon. While the examples described here have used social networks to predict the spread of infectious diseases, this method of finding and observing individuals central to a social network could be useful across many different fields of study, such as examining whether an intervention is being adopted or if an advertising campaign is succeeding at nudging people toward healthier behavior.
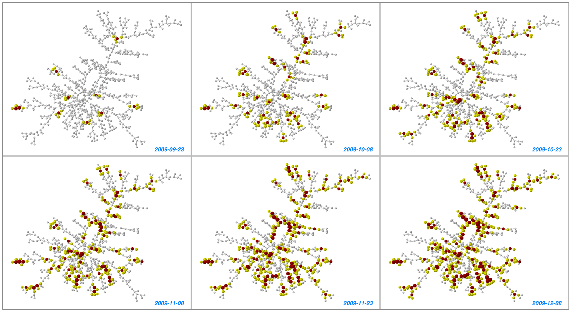
Figure 3: Progression of flu contagion in a friendship network over time21. Red: infected individuals, yellow: friends of infected individuals. Node size is proportional to the number of friends infected.
Google Street View: How a neighborhood’s physical characteristics may affect connectedness
The physical characteristics of people’s living environments can impact their mental and physical health at both an individual and a community level. For example, accessible sidewalks can encourage physical activity [23], while access to natural spaces (e.g., greenery, trees) has been associated with increased social contact and interactions between neighbors [24], as well as lower crime rates [25]. Other physical characteristics of neighborhoods such as cleanliness and abandoned buildings have been linked to depression, stress, and violence [26]. These markers of “neighborhood disorder” are intertwined with larger sociocultural problems such as systemic and structural inequality [27–30], and more rigorous and unbiased assessments of these physical characteristics of neighborhoods are needed.
Historically, in order to perform neighborhood assessments, researchers had to visit the neighborhoods themselves, which was often expensive, time-consuming, and subject to the biases of the researchers. In an invited commentary for the American Journal of Epidemiology, Jackelyn Hwang highlights a method for assessing the condition of a neighborhood virtually using Google Street View (GSV) [31]. At first, researchers were skeptical that this method could provide enough sensory information to adequately assess neighborhoods. (For example, GSV does not capture the sound of cars honking in the background.) However, Mooney and colleagues [32] compared audits done with GSV side by side with in-person audits, and found that being able to sample more evenly across a neighborhood with the virtual audit outweighed the precision lost by not being able to capture all of the information researchers could detect in-person. GSV also allows multiple researchers to assess the same images, reducing the likelihood of researcher bias. Additionally, this method allows researchers to go back in time, as GSV provides images dating as far back as 2007. Many of the images are updated annually, so researchers can assess how a neighborhood is changing over time and whether interventions and improvements to the neighborhood have been effective.
This retrospective feature was used by researchers to count the number of people out-and-about in New Orleans [33]. They compared post-Katrina New Orleans in 2007 with post-revival New Orleans in 2016. The researchers designated 1,500 points around the city to evaluate, which included counting the number of visible people outdoors. They found that over those nine years a huge increase in the number of people outside occurred (from an average of 1.1 people per point in 2007 to 3.5 in 2016), and that there was much greater diversity of activity. Most of the people seen in 2007 could be identified as workers repairing damage from the hurricane, whereas in 2016 people were more likely to be congregating, relaxing, or walking and biking together. This was especially true in the city’s more central neighborhoods, where most of the restoration efforts were concentrated.
Brookfield and Tilley [23] also used Google Street View to evaluate whether their city conditions were conducive to social interaction and physical activity. They assessed the ‘walkability’ of certain streets used primarily by older adults. By using GSV, the researchers were able to gain a better understanding of the characteristics that encourage older adults to be out walking in their neighborhood (e.g., good pavement quality and green spaces), as well as other factors that were initially assumed to be important (e.g., curb quality) but had little effect on walking habits. GSV still has several limitations, such as not being able to control for time of day or year, but its objectivity, pervasiveness, and cost can make it an incredibly useful tool for researchers, city planners, and policy makers to understand which aspects of a city or neighborhood might be improved in order to increase residents’ well-being and opportunities for social engagement.
Digital lexical with geotags: Predicting community-level outcomes with social media posts
Given the large amount of content people produce regularly on social media (e.g., Twitter, Facebook), researchers have devised ways to analyze the text that people post to learn more about their thoughts and experiences. This “lexical” approach was reviewed in the previous section as a method for understanding individual differences (e.g., in mental health status); in instances where posts are geotagged, researchers can move beyond the individual and analyze data on a community-level, such as by neighborhood, city, or state.
Schwartz, Eichstaedt, and colleagues [34] analyzed the text of geotagged Tweets to look at differences in life satisfaction according to county of residence. They found that several clusters of words were highly correlated with higher life satisfaction (Figure 4), such as words pertaining to physical activity, community engagement, and pro-social activities (e.g., donating money). Counties that had lower instances of these words appearing in posts were considered to have lower well-being, while counties with a high frequency of these words were considered to have higher well-being. This method allowed the researchers to not only understand which regions of the United States are “doing well,” but also to decipher specific factors that might be influencing their status.

Figure 4: Examples of groups of words that fall into topics typically associated with well-being [34]. The left two word clouds are positively correlated with well-being, and the right two word clouds are negatively correlated with well-being. Larger words were used more frequently within the topic.
Participant privacy and security

The methods described here are now more accessible than ever due to the widespread availability of technology. At the same time, these advances raise new issues for participant privacy. Many of the methods involve collecting personal information online, and researchers need to be diligent in ensuring that participants’ rights are upheld.
Because these methods and technologies are still relatively new, norms and rules around what researchers can and cannot do are still being established. In some instances, as with many social media sites, boundary lines are actively being drawn and redrawn regarding what user information is considered public or private. However, researchers who frequently use smartphones in their research have offered some preliminary guidelines in two key areas [35]:
- Participant understanding and consent: It is important to communicate clearly with participants about what types of information or sensing capability (e.g., camera or voice recording) the researchers will have access to, for how long, and who it will be shared with. This enables the participants to make a more informed decision about whether or not to participate.
- Data security: With smartphones and other modern technology, the amount of information available about participants can seem limitless; however, collecting more data than needed puts participants at undue risk. As such, researchers employing these technologies should:
- Evaluate precisely what kind of data they will need and collect and retain only what is crucially relevant,
- Take efforts to de-identify data so that participants’ study data cannot be linked back to them as an individual,
- Allow participants to easily withdraw their data from the study at any time.
References
- Putnam, R. D. (2000). Bowling alone: The collapse and revival of American community. Simon and Schuster.
- Stanford Center on Longevity. Stanford University. The Sightlines Project. Retrieved from https://longevity.stanford.edu/the-sightlines-project/
- Csikszentmihalyi, M., & Larson, R. (2014). Validity and reliability of the experience-sampling method. In Flow and the foundations of positive psychology (pp. 35–54). Springer, Dordrecht.
- Carstensen, L. L., Turan, B., Scheibe, S., Ram, N., Ersner-Hershfield, H., Samanez-Larkin, G. R., … Nesselroade, J. R. (2011). Emotional experience improves with age: Evidence based on over 10 years of experience sampling. Psychology and Aging, 26(1), 21–33. https://doi.org/10.1037/a0021285
- Carstensen, L. L., Pasupathi, M., Mayr, U., & Nesselroade, J. R. (2000). Emotional experience in everyday life across the adult life span. Journal of Personality and Social Psychology, 79(4), 644–655. https://doi.org/10.1037/0022-3514.79.4.644
- English, T., & Carstensen, L. L. (2014). Selective narrowing of social networks across adulthood is associated with improved emotional experience in daily life. International Journal of Behavioral Development, 38(2), 195–202. https://doi.org/10.1177/0165025413515404
- Kahneman, D., Krueger, A. B., Schkade, D. A., Schwarz, N., & Stone, A. A. (2004). A Survey Method for Characterizing Daily Life Experience: The Day Reconstruction Method. Science, 306(5702), 1776–1780. https://doi.org/10.1126/science.1103572
- Srivastava, S., Angelo, K. M., & Vallereux, S. R. (2008). Extraversion and positive affect: A day reconstruction study of person–environment transactions. Journal of Research in Personality, 42(6), 1613–1618. https://doi.org/10.1016/j.jrp.2008.05.002
- Demiray, B., Mischler, M., & Martin, M. (2017). Reminiscence in Everyday Conversations: A Naturalistic Observation Study of Older Adults. The Journals of Gerontology: Series B, 74(5), 745–755. https://doi.org/10.1093/geronb/gbx141
- Reeves, B., Ram, N., Robinson, T. N., Cummings, J. J., Giles, C. L., Pan, J., … Yeykelis, L. (2019). Screenomics: A Framework to Capture and Analyze Personal Life Experiences and the Ways that Technology Shapes Them. Human–Computer Interaction, 1–52. https://doi.org/10.1080/07370024.2019.1578652
- Weintraub, W. (1981). Verbal behavior: Adaptation and psychopathology. New York: Springer Publishing Company.
- Weintraub, W. (1989). Verbal behavior in everyday life. Springer Publishing Co.
- Tausczik, Y. R., & Pennebaker, J. W. (2010). The Psychological Meaning of Words: LIWC and Computerized Text Analysis Methods. Journal of Language and Social Psychology, 29(1), 24–54. https://doi.org/10.1177/0261927X09351676
- Pennebaker, J. W., Boyd, R. L., Jordan, K., & Blackburn, K. (2015). The Development and Psychometric Properties of LIWC2015.
- Slatcher, R. B., Vazire, S., & Pennebaker, J. W. (2008). Am “I” more important than “we”? Couples’ word use in instant messages. Personal Relationships, 15(4), 407–424. https://doi.org/10.1111/j.1475-6811.2008.00207.x
- Eichstaedt, J. C., Smith, R. J., Merchant, R. M., Ungar, L. H., Crutchley, P., Preoţiuc-Pietro, D., … Schwartz, H. A. (2018). Facebook language predicts depression in medical records. Proceedings of the National Academy of Sciences, 115(44), 11203–11208. https://doi.org/10.1073/pnas.1802331115
- Herrera, F., Bailenson, J., Weisz, E., Ogle, E., & Zaki, J. (2018). Building long-term empathy: A large-scale comparison of traditional and virtual reality perspective-taking. PLOS ONE, 13(10), e0204494. https://doi.org/10.1371/journal.pone.0204494
- Christakis, N. A., & Fowler, J. H. (2013). Social contagion theory: Examining dynamic social networks and human behavior. Statistics in Medicine, 32(4), 556–577. https://doi.org/10.1002/sim.5408
- Christley, R. M., Pinchbeck, G. L., Bowers, R. G., Clancy, D., French, N. P., Bennett, R., & Turner, J. (2005). Infection in Social Networks: Using Network Analysis to Identify High-Risk Individuals. American Journal of Epidemiology, 162(10), 1024–1031. https://doi.org/10.1093/aje/kwi308
- Mossong, J., Hens, N., Jit, M., Beutels, P., Auranen, K., Mikolajczyk, R., … Edmunds, W. J. (2008). Social Contacts and Mixing Patterns Relevant to the Spread of Infectious Diseases. PLoS Medicine, 5(3), e74. https://doi.org/10.1371/journal.pmed.0050074
- Christakis, N. A., & Fowler, J. H. (2010). Social Network Sensors for Early Detection of Contagious Outbreaks. PLoS ONE, 5(9), e12948. https://doi.org/10.1371/journal.pone.0012948
- Feld, S. L. (1991). Why Your Friends Have More Friends Than You Do. The American Journal of Sociology, 96(6), 1464–1477.
- Brookfield, K., & Tilley, S. (2016). Using Virtual Street Audits to Understand the Walkability of Older Adults’ Route Choices by Gender and Age. International Journal of Environmental Research and Public Health, 13(11), 1061. https://doi.org/10.3390/ijerph13111061
- Kuo, F. E., Sullivan, W. C., Coley, R. L., & Brunson, L. (1998). Fertile Ground for Community: Inner-City Neighborhood Common Spaces. American Journal of Community Psychology, 26(6), 823–851. https://doi.org/10.1023/A:1022294028903
- Kuo, F. E., & Sullivan, W. C. (2001). Environment and Crime in the Inner City: Does Vegetation Reduce Crime? Environment and Behavior, 33(3), 343–367. https://doi.org/10.1177/0013916501333002
- Sampson, R. J., Morenoff, J. D., & Gannon-Rowley, T. (2002). Assessing “Neighborhood Effects”: Social Processes and New Directions in Research. Annual Review of Sociology, 28(1), 443–478. https://doi.org/10.1146/annurev.soc.28.110601.141114
- Osypuk, T. L., & Acevedo-Garcia, D. (2010). Beyond individual neighborhoods: A geography of opportunity perspective for understanding racial/ethnic health disparities. Health & Place, 16(6), 1113–1123. https://doi.org/10.1016/j.healthplace.2010.07.002
- White, K., & Borrell, L. N. (2011). Racial/ethnic residential segregation: Framing the context of health risk and health disparities. Health & Place, 17(2), 438–448. https://doi.org/10.1016/j.healthplace.2010.12.002
- Sampson, R. J., & Raudenbush, S. W. (2004). Seeing Disorder: Neighborhood Stigma and the Social Construction of “Broken Windows.” Social Psychology Quarterly, 67(4), 319–342. https://doi.org/10.1177/019027250406700401
- Sharkey, P., & Faber, J. W. (2014). Where, When, Why, and For Whom Do Residential Contexts Matter? Moving Away from the Dichotomous Understanding of Neighborhood Effects. Annual Review of Sociology, 40(1), 559–579. https://doi.org/10.1146/annurev-soc-071913-043350
- Hwang, J. (2017). Invited Commentary: Observing Neighborhood Physical Disorder in an Age of Technological Innovation. American Journal of Epidemiology, 186(3), 274–277. https://doi.org/10.1093/aje/kwx005
- Mooney, S. J., Bader, M. D. M., Lovasi, G. S., Teitler, J. O., Koenen, K. C., Aiello, A. E., … Rundle, A. G. (2017). Street Audits to Measure Neighborhood Disorder: Virtual or In-Person? American Journal of Epidemiology, 186(3), 265–273. https://doi.org/10.1093/aje/kwx004
- Campanella, R. (2017). People-Mapping Through Google Street View. Places Journal. https://doi.org/10.22269/171114
- Schwartz, H. A., Eichstaedt, J. C., Kern, M. L., Dziurzynski, L., Lucas, R. E., Agrawal, M., … Ungar, L. (n.d.). Characterizing Geographic Variation in Well-Being using Tweets. Seventh International AAAI Conference on Weblogs and Social Media, 2013.
- Harari, G. M., Lane, N. D., Wang, R., Crosier, B. S., Campbell, A. T., & Gosling, S. D. (2016). Using Smartphones to Collect Behavioral Data in Psychological Science: Opportunities, Practical Considerations, and Challenges. Perspectives on Psychological Science, 11(6), 838–854. https://doi.org/10.1177/1745691616650285
Chapter 3. The Impact of Widowhood on Social Engagement and Subjective Wellbeing
Jialu L. Streeter, Stanford Center on Longevity
According to the US Census Bureau, the average age of widowhood is 59 years old. As women tend to outlive their husbands, widowhood affects women disproportionately. In 2018, approximately 3.5 million men and 11.4 million women in the United States were widowed. By age 65, about 2% of men and 15% of women have lost their spouses. Among all adults aged 65+, 10% of men and 33% of women are widowed.
The literature has offered ample evidence on the health effects of widowhood. The term “widowhood effect” was coined to describe the increased likelihood for a recently widowed person to die. Following 12,000 couples between 1964 and 1973, researchers found that mortality following spousal loss rose significantly in both men and women after adjusting for demographic and socioeconomic covariates [1]. The death of a spouse has a stronger effect on excess mortality in men than in women [2].
While mortality is a direct indicator of health outcomes, the wellbeing of widowed individuals goes well beyond that. It can be gauged by several vital measures, including life satisfaction [3,4], social engagement behaviors [5,6], and emotional and mental health [7,8].
Through reviewing existing literature, as well as analyzing the Health and Retirement Study’s data, we aim to gain a deeper understanding of several questions: how do widowed persons compare to their married or single counterparts in terms of emotional wellbeing? How does widowhood affect the overall life satisfaction of the surviving spouses? Do people ever return to their pre-widowhood baseline happiness? Are there any trajectories of emotional changes around the time of spousal loss? Do men and women cope with widowhood differently? And finally, do individuals rely more on their social circles or more on social activities to cope with widowhood?
1. Some Big trends in Widowhood
Life expectancy in the US has increased by more than 20 years in the last century (Figure 1). In 2010, female life expectancy at birth was 81.1 years, compared to men’s 76.2 years. In addition to the gender gap in longevity, men tend to be married to women younger than them, and as a result, women are more likely to be widowed at some point in life. According to Pew Research [9] (Figure 2), in 1900, about 5% and 7% of men and women over age 65 lived alone. The trend has primarily diverged over the years. In 2014, about 32% of women aged 65+ live alone, much higher than the 18% among men.
Figure 1: Life Expectancy at Birth, USA, 1900-2010
Figure 2: Percent of men and women over 65 who live alone (PEW Research Center [9])
Marital status, including widowhood, is a strong predictor of mental health conditions. A commonly used measure is the Center for Epidemiologic Studies – Depression (CES-D) scale [10], which monitors self-reported symptoms associated with depression experienced in the previous week. To compare mental health conditions across people with different marital statuses, we make use of the CES-D data in the Health and Retirement Study (HRS). The data contain eight individual items reflecting significant facets of mental health challenges: depressed mood, sadness, feeling of loneliness, unhappiness, psychomotor retardation, and sleep disturbance. The CES-D score is simply the total number of issues facing a person out of the eight items. A higher score indicates more psychological health issues. Shown in Figure (3, left), married people have the best (lowest) score compared to widowed and divorced individuals. In particular, people widowed at a relatively younger age (e.g., in their 50s) report more mental health challenges than those who widowed in their 70s and 80s.
In addition to facing worsened mental health, widowed individuals, on average, are less financially secure than their married counterparts [11–21]. Figure 3 compares family wealth by marital status. Based on the HRS data, an ordinary 70-year old married person has $190,000 family wealth and $50,000 income (household size-adjusted), compared to $135,000 and $30,000 for a widowed person of the same age. Compared to pre-widowhood, women’s living standards declined after widowhood [12,20]. Many factors contribute to widows’ financial insecurity. A good deal of family wealth is lost when the husband dies due to medical spending and funeral costs [22]. Women generally have a lower lifetime income and are less engaged in retirement planning [23]. A mismatch exists between life insurance holdings and underlying financial vulnerabilities [24]. Finally, a husband’s mortality correlates strongly with his lifetime health and income; thus, women widowed at a young age are often poor long before the death of their husbands [25].
Figure 3: Mental health score and family wealth by marital status, author’s calculation (Wealth is in 2014 dollars).
2. Changes in Subjective Wellbeing and Social Engagement upon Widowhood
Research has uncovered a large amount of between-person variations in their baseline level of life satisfaction and social engagement behaviors. Now, are individual baseline levels stable over time? If not, to what extent is the baseline level affected by key life events? In other words, does an adverse life event have only a short-term shock, or does it carry a more permanent influence? In this section, we discuss changes in people’s life satisfaction, emotional and mental health conditions, and social engagement patterns before and after widowhood.
2.1 Life Satisfaction
In psychology, the Adaptation Level Theory (“Hedonic Treadmill Theory”) proposed by Brickman and Campbell [26] in 1971 suggests that people tend to maintain a happiness “set point.” Even though people may react to positive or adverse life experiences, in general, they return to their stable levels of satisfaction, which is dominated by their personality and genetic predisposition. For example, lottery winners are no happier than the average person daily in the long term [27]. Similarly, people who experience unfavorable life circumstances bounce back more or less to their pre-event level.
However, there can be a fair amount of variation in the individual-level adaptation process. In a prominent study [28], researchers test the adaptation level theory using a large scale longitudinal data set, by examining the effects of both marriage and widowhood on life satisfaction. Specifically, each person has a “baseline phase” (one to eight years before an event), a “reaction phase” (one year before to one year after the event), and an “adaptation phase” (one year to six years after the event).
The researchers do not believe that the reaction-adaption process can be described as a hedonic treadmill, as the analogy implies that adaptation is inevitable. They found that, on average, people experience a sharp setback in their life satisfaction right after the death of a spouse, and then return to a place that’s below but reasonably close to the initial level. What’s worth noting is the significant standard deviation (Figure 4), indicating a great deal of variability in the rate at which people change. Specifically, people who had a strong reaction to the death of a spouse (“-1 SD reactivity”) went through a slow and partial adaptation, and their life satisfaction remained at a lower level in the long run – in other words, they appeared to establish a new baseline following widowhood.
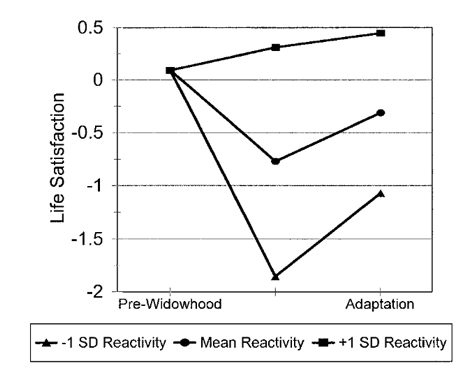
Figure 4: Adaptation to widowhood as a function of one’s reaction to widowhood (Lucas, et al. 2003, p.535)
2.2 Emotional and Mental Health
As described previously, we use the CES-D questionnaire provided by the Health and Retirement Study to examine how widowhood impacts emotional and mental health. Using a panel fixed effect model, we can detect changes in people’s psychological conditions in the years before and after the loss of spouse (Figure 5). To be clear, we use two-years before widowhood as “baseline,” and higher values of CES-D correspond to worse mental health.
Not surprisingly, people were happier and less depressed in the years before widowhood. In the exact year of spousal loss, both genders experienced deteriorating emotions, but the changes are more substantial among men. Moreover, the impact of widowhood is considerably longer-lasting for men. While women return to their baseline within 4-5 years, it takes men about ten years to fully return to their pre-widowhood baseline.

Figure 5: Fixed-effect model estimates for the impact of widowhood on emotions (depression, sadness, loneliness, unhappiness, not enjoying life), author’s calculation using the HRS data.
Widowhood is more depressing for men than women, primarily because married men were much less depressed than married women, but widowed men and women were comparably depressed. [32] Men who remain alone after losing their partners are at a higher risk of developing symptoms of chronic depression [33].
2.3 Social Participation: Group Activities and Contacts with Social Network
As defined by Rowe and Kahn [34], successful aging consists of a low probability of disease and disability, high cognitive and physical functional capacity, and sustained engagement in social and productive activities. Social participation is usually measured by formal (e.g., meeting attendance, religious participation, and volunteer obligations) and informal (e.g., telephone contact and social interactions with friends) social roles [35].
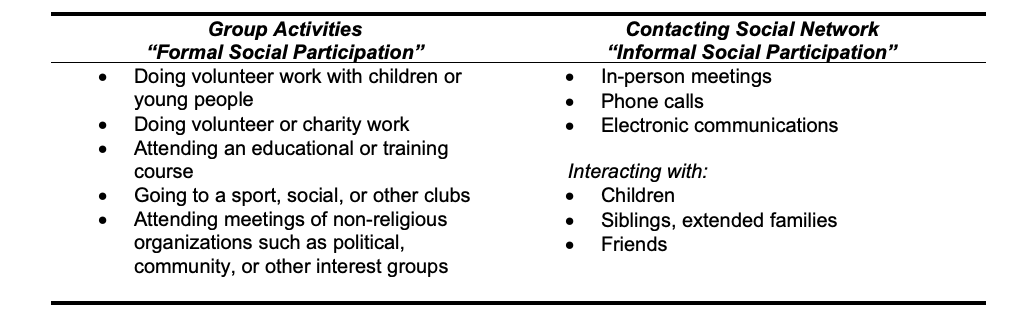
Table 1: Definitions of formal and informal social participation (based on the HRS psychosocial and lifestyle questionnaire36)
Using data from the Changing Lives of Older Couples study, researchers found that widowed persons have higher levels of informal social participation than nonwidowed. In contrast, formal social participation levels are comparable between the two groups.[35] Using more recent data from the Health and Retirement Study (2008-2014), we found the same patterns. As illustrated in Figure (6), the monthly frequencies of participation in group activities show no significant differences between the widowed and the married; however, widowed individuals contact their friends and family members by about 25% more than the married group.
To be clear, we use data from the Health and Retirement Study’s Psychosocial and Lifestyle questionnaire, in the attempt to gain some understanding about how social engagement – including participation in group activities, frequencies of contacting friends and families, and social support – is related to the years relative to the onset of widowhood. Though the HRS is longitudinal, its Psychosocial and Lifestyle module is relatively recent and administered less frequently than the main module. Therefore, we don’t have enough data observations to establish the causal relationship between widowhood and within-person changes. Instead, we utilize the limited information to visualize cross-sectional comparisons, which is useful, but readers must fully understand its limitations.
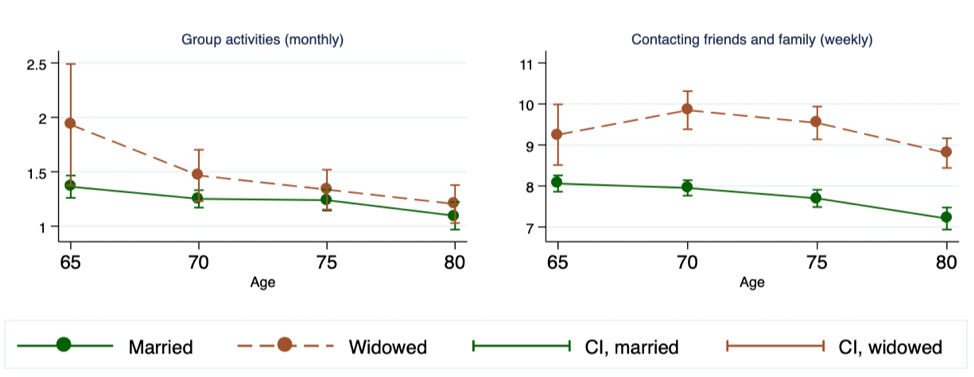
Figure 6: Social Participation: Married vs. Widowed (Author’s calculations using HRS data). The plot includes mean estimates and 95% confidence intervals.
Figure (7) depicts the relationship between social participation and the widowhood duration. For both genders, people widowed for 6-10 years participate in more group activities than those not widowed yet as well as those newly widowed. The group with the least social participation is women within five years before being widowed, as they were likely spending a considerable amount of time taking care of their husbands, and were more or less cut off from other social outings.
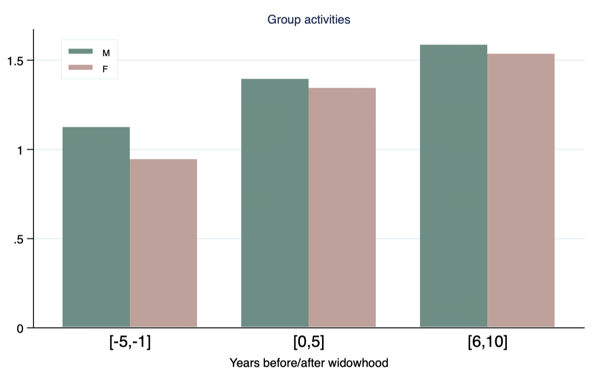
Figure 7: Weekly frequency of group activities, against the length of widowhood. (Author’s calculation using HRS data)
As shown in Figure (8), newly widowed men and women both contact their family and friends more frequently than those not widowed yet. However, in the longer-term (6~10 years after the death of a spouse), widowed men have substantially less frequent contacts than widowed women (4.3 vs. 6.2 times per week).
One must recognize that men and women in general exhibit different “styles” in forming and maintaining social relationships, which may explain some of the gender differences discussed here. For example, when ill and in need of a helping network, men are more likely to receive assistance from spouses, and women are more likely to receive help from non-spousal others, even when their husbands are available [37]. Moreover, men receive emotional support primarily from their spouses, whereas women drew more heavily on their friends and relatives and children for emotional support [38]. After losing a spouse, women are more likely than men to form new friendships and other social contacts[ 39]. Men, on the other hand, are less likely than women to make up for network loss.
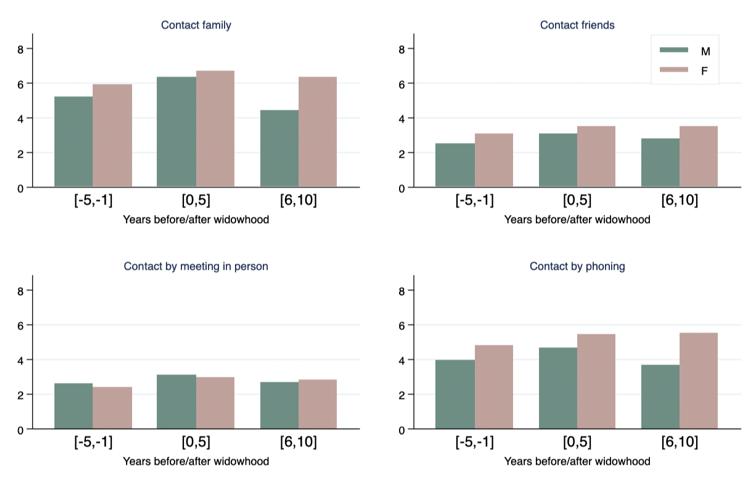
Figure 8: Monthly frequencies of contact with social connections (Author’s calculation using HRS data).
2.4 Quality of Social Relationships
Quality of social relationships includes positive aspects of relationships, such as emotional support, and negative aspects of relationships, such as conflicts and stress [40]. When surrounded by a network of friends and family members, a person can have both positive and strained relationships. Even with the same friend or family member, the quality of the relationship can vary substantially from time to time.
Social support helps alleviate stress following natural disasters such as severe flood [41] as well as a life crisis, such as the loss of family members. Social support protects people in crisis from a wide variety of pathological states, including depression, alcoholism, and social breakdown syndrome. Furthermore, social support may reduce the amount of medication required, accelerate recovery, and facilitate compliance with medication prescriptions [42].
Using the Health and Retirement Study data, we compared the quality of relationships, both positive and negative, received by widowed men and women (Figure 9). Overall, the widowed group reported having more positive than negative relationships. Widowed women perceive of having more positive support from their social circles than widowed men do. During the most challenging times, i.e., a few years before and after the death of a spouse, the level of positive support is considerably higher. After about 6-10 years, when things quiet down, widowed persons, especially men, experience a reduced level of positive support.
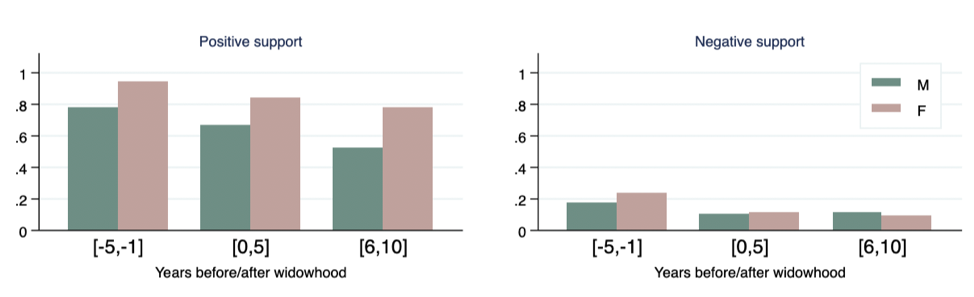
Figure 9: Quality of relationships received by widows and widowers (Author’s calculation using HRS data).
3. Summary
Life expectancy has increased dramatically in the US in the last century. Longer lifespan introduces more end-of-life uncertainties. As a result, both men and women today are more likely than in the past to lose a spouse later in life, and widowed individuals today are expected to spend more years alone than those one hundred years ago.
Given the fact that widowhood takes up a substantial portion of ordinary Americans’ lives, we need to understand its implications. In this report, we reviewed many studies on subjective wellbeing in widowhood. We supplemented the literature review with analysis using the Health and Retirement Study (HRS) data.
Compared to the divorced and never married, widowed individuals appear to be more financially secure, but suffer from more mental health challenges. After all, losing a spouse is one of the most devastating life events. Managing negative feelings, such as loneliness and depression, is vital in bereavement.
In terms of general life satisfaction, one needs to pay close attention to the considerable heterogeneity in individual reactions to the trauma as well as their recovery process. Though the average person may appear to adapt to widowhood and return to pre-widowhood baseline happiness, many others experience a much stronger reaction, and their life satisfaction remains at a low level for a prolonged period. Family members and other support group members should keep in mind the significant between-person variations, and not assume all of them would bounce back to their pre-shock level of happiness.
Instead of the overall life satisfaction measure, one can also look at the itemized emotional and mental health conditions. Using a panel fixed-effect regression model, we estimated that people’s negative emotions – namely, depression, loneliness, sadness, unhappiness – drastically deteriorate in the year of the spousal loss. Moreover, men experience more hardship in bereavement. Widowed men suffer from a sharper increase in negative emotions than widowed women in the short term, and it took a lot more time for men to recover.
Many studies have shown that active engagement with society and community is essential for one’s emotional and mental health. After losing a spouse, social participation is deemed more vital for the surviving spouse to stay connected. Compared to their married counterparts, widowed individuals contact their friends and family members by about 25% more. Interestingly, no significant differences are found between married and widowed in their participation in group activities. This finding implies that widowed persons are more likely to fill the emotional gap by reaching out to their close social circle, rather than taking on more social activities such as volunteering. In that sense, offering widowed elderly many new group activities may not help alleviate their stress and depressive symptoms.
Takeaways
- Everyone reacts to widowhood differently. We need to pay close attention to the large between-person variations rather than focusing entirely on the average person. Some widowed individuals may suffer from strong reactions to the trauma and face a prolonged recovery.
- Gender plays an essential role in widowhood experiences. Widowed men and women differ in their degrees of feeling negative emotions, the length of recovery periods, and their contacts of social circle and perceptions of social support.
- Close social circles are the most critical support group for widowed individuals. In comparison, social group activities appear to be less instrumental in helping widowed persons stay connected.
References
- Schaefer C, Quesenberry CP, Wi S. Mortality following conjugal bereavement and the effects of a shared environment. Am J Epidemiol. 1995;141(12):1142-1152. doi:10.1093/oxfordjournals.aje.a117387
- Martikainen P, Valkonen T. Mortality after death of spouse in relation to duration of bereavement in Finland. J Epidemiol Community Health. 1996;50(3):264-268. doi:10.1136/jech.50.3.264
- Lags And Leads in Life Satisfaction: a Test of the Baseline Hypothesis* – Clark – 2008 – The Economic Journal – Wiley Online Library. https://onlinelibrary.wiley.com/doi/full/10.1111/j.1468-0297.2008.02150.x. Accessed January 13, 2020.
- Fujita F, Diener E. Life Satisfaction Set Point: Stability and Change. J Pers Soc Psychol. 2005;88(1):158-164. doi:10.1037/0022-3514.88.1.158
- Bennett KM. Psychological wellbeing in later life: the longitudinal effects of marriage, widowhood and marital status change. Int J Geriatr Psychiatry. 2005;20(3):280-284. doi:10.1002/gps.1280
- Pihlblad CT, Adams DL. Widowhood, Social Participation and Life Satisfaction. Aging Hum Dev. 1972;3(4):323-330. doi:10.2190/DNQ7-TM1K-3RXB-TK23
- Onrust SA, Cuijpers P. Mood and anxiety disorders in widowhood: A systematic review. Aging Ment Health. 2006;10(4):327-334. doi:10.1080/13607860600638529
- Wilcox S, Evenson KR, Aragaki A, Wassertheil-Smoller S, Mouton CP, Loevinger BL. The effects of widowhood on physical and mental health, health behaviors, and health outcomes: The Women’s Health Initiative. Health Psychol. 2003;22(5):513-522. doi:10.1037/0278-6133.22.5.513
- Stepler R. 1. Gender gap in share of older adults living alone narrows. Pew Res Center’s Soc Demogr Trends Proj. February 2016. https://www.pewsocialtrends.org/2016/02/18/1-gender-gap-in-share-of-older-adults-living-alone-narrows/. Accessed December 27, 2019.
- The CES-D Scale: A Self-Report Depression Scale for Research in the General Population – Lenore Sawyer Radloff, 1977. https://journals.sagepub.com/doi/10.1177/014662167700100306. Accessed December 28, 2019.
- Angel JL, Jiménez MA, Angel RJ. The Economic Consequences of Widowhood for Older Minority Women. The Gerontologist. 2007;47(2):224-234. doi:10.1093/geront/47.2.224
- Bound J, Duncan GJ, Laren DS, Oleinick L. Poverty dynamics in widowhood. J Gerontol. 1991;46(3):S115-124.
- Carr D. Gender, Preloss Marital Dependence, and Older Adults’ Adjustment to Widowhood. J Marriage Fam. 2004;66(1):220-235. doi:10.1111/j.0022-2445.2004.00016.x
- Holden KC, Kuo HH. Complex marital histories and economic well-being: the continuing legacy of divorce and widowhood as the HRS cohort approaches retirement. The Gerontologist. 1996;36(3):383-390. doi:10.1093/geront/36.3.383
- Holden KC, Burkhauser RV, Feaster DJ. The timing of falls into poverty after retirement and widowhood. Demography. 1988;25(3):405-414. doi:10.2307/2061540
- Hurd M, Wise D. The Wealth and Poverty of Widows: Assets Before and After the Husband’s Death. Cambridge, MA: National Bureau of Economic Research; 1987:w2325. doi:10.3386/w2325
- McGarry K, Schoeni RF. Widow(er) Poverty and Out-of-Pocket Medical Expenditures Near the End of Life. J Gerontol Ser B. 2005;60(3):S160-S168. doi:10.1093/geronb/60.3.S160
- Shuart AN, Weaver DA. Widowed Before Retirement: Social Security Benefit Claiming Strategies. :9.
- Smith KR, Zick CD. The incidence of poverty among the recently widowed: Mediating factors in the life course. J Marriage Fam. 1986;48(3):619-630. doi:10.2307/352048
- Zick CD, Smith KR. Patterns of economic change surrounding the death of a spouse. J Gerontol. 1991;46(6):S310-320.
- Zick CD, Smith KR. Immediate and Delayed Effects of Widowhood on Poverty: Patterns from the 1970s. The Gerontologist. 1986;26(6):669-675. doi:10.1093/geront/26.6.669
- Zick CD, Holden K. An Assessment of the Wealth Holdings of Recent Widows. J Gerontol B Psychol Sci Soc Sci. 2000;55(2):S90-S97. doi:10.1093/geronb/55.2.S90
- Lusardi A, Mitchell OS. Planning and Financial Literacy: How Do Women Fare? Am Econ Rev. 2008;98(2):413-417. doi:10.1257/aer.98.2.413
- Bernheim BD, Carman KG, Gokhale J, Kotlikoff LJ. The Mismatch Between Life Insurance Holdings and Financial Vulnerabilities: Evidence from the Survey of Consumer Finances. National Bureau of Economic Research; 2001. doi:10.3386/w8544
- Weir D, Willis RJ, Sevak P. The Economic Consequences of Widowhood. SSRN Electron J. 2002. doi:10.2139/ssrn.1084677
- Brickman P, Campbell DT. Hedonic relativism and planning the good society. Adapt-Level Theory MHAppley Ed. 1971.
- Brickman P, Coates D, Janoff-Bulman R. Lottery winners and accident victims: is happiness relative? J Pers Soc Psychol. 1978;36(8):917-927. doi:10.1037//0022-3514.36.8.917
- Lucas RE, Clark AE, Georgellis Y, Diener E. Reexamining adaptation and the set point model of happiness: Reactions to changes in marital status. J Pers Soc Psychol. 2003;84(3):527-539. doi:10.1037/0022-3514.84.3.527
- Infurna FJ, Wiest M, Gerstorf D, et al. Changes in life satisfaction when losing one’s spouse: individual differences in anticipation, reaction, adaptation and longevity in the German Socio-economic Panel Study (SOEP). Ageing Soc. 2017;37(5):899-934. doi:10.1017/S0144686X15001543
- Berg A, Hoffman L, Hassing L, McClearn G, Johansson B. What Matters, and What Matters Most, for Change in Life Satisfaction in the Oldest-Old? A Study over 6 Years among Individuals 80. Fac Publ Dep Psychol. March 2009. https://digitalcommons.unl.edu/psychfacpub/419.
- Chipperfield JG, Havens B. Gender Differences in the Relationship Between Marital Status Transitions and Life Satisfaction in Later Life. J Gerontol Ser B. 2001;56(3):P176-P186. doi:10.1093/geronb/56.3.P176
- Lee GR, DeMaris A, Bavin S, Sullivan R. Gender differences in the depressive effect of widowhood in later life. J Gerontol B Psychol Sci Soc Sci. 2001;56(1):S56-61. doi:10.1093/geronb/56.1.s56
- van Grootheest DS, Beekman ATF, Broese van Groenou MI, Deeg DJH. Sex differences in depression after widowhood. Do men suffer more? Soc Psychiatry Psychiatr Epidemiol. 1999;34(7):391-398. doi:10.1007/s001270050160
- Rowe JW, Kahn RL. Successful Aging. The Gerontologist. 1997;37(4):433-440. doi:10.1093/geront/37.4.433
- Utz RL, Carr D, Nesse R, Wortman CB. The Effect of Widowhood on Older Adults’ Social ParticipationAn Evaluation of Activity, Disengagement, and Continuity Theories. The Gerontologist. 2002;42(4):522-533. doi:10.1093/geront/42.4.522
- Smith J, Ryan L, Fisher G, et al. HRS Psychosocial and Lifestyle Questionnaire 2006-2016.
- Chappell NL. Health and Helping among the Elderly: Gender Differences. J Aging Health. 1989;1(1):102-120. doi:10.1177/089826438900100107
- Gurung RAR, Taylor SE, Seeman TE. Accounting for changes in social support among married older adults: Insights from the MacArthur Studies of Successful Aging. Psychol Aging. 2003;18(3):487-496. doi:10.1037/0882-7974.18.3.487
- Lamme S, Dykstra PA, Groenou MIBV. Rebuilding the network: New relationships in widowhood. Pers Relatsh. 1996;3(4):337-349. doi:10.1111/j.1475-6811.1996.tb00120.x
- Umberson D, Montez JK. Social Relationships and Health: A Flashpoint for Health Policy. J Health Soc Behav. 2010;51(Suppl):S54-S66. doi:10.1177/0022146510383501
- Kaniasty K, Norris FH. A test of the social support deterioration model in the context of natural disaster. J Pers Soc Psychol. 1993;64(3):395-408. doi:10.1037/0022-3514.64.3.395
- Cobb S. Social support as a moderator of life stress. Psychosom Med. 1976;38(5):300-314. doi:10.1097/00006842-197609000-00003
Gender Differences in Social Engagement and Their Implications for Health and Subjective Well-being
Jialu L. Streeter
Gender is associated with many social and behavioral differences. Researchers have explored gender-related differences in helping behavior, aggressive behavior, influenceability, and nonverbal behaviors (Eagly, 2013). Analyses of genetics and physiology are also used to help explain the observed gender dissimilarities. For example, one recent study uses brain imaging to explain why boys are more drawn to video games than girls (Dong et al., 2018).
This chapter focuses on gender differences in the domain of social engagement. When considered in the aggregate, men and women appear to diverge in the way they socialize, gain acceptance into peer groups, compete for status within a social structure, maintain friendships, and give and receive emotional support. Such differences have been observed not only among adults but also among young children. Gender dissimilarities are found in the degree to which one views oneself as dependent on others, the size and content of one’s social network, and the giving and receiving of social support. Such gender gaps in social engagement bear essential implications as they may lead to differences in health outcomes and subjective wellbeing.
Social engagement is composed of several elements

- Quantity: the number of people in one’s social network (family members, friends, coworkers, etc.).
- Quality: features of one’s social network that matter for the types of emotional exchanges with others.
- Positive: social support includes actual support received and the perceived availability of support.
- Negative: social strain refers to network exits, problematic exchanges, network stress transmission, and failed support attempts. Social strain can involve actions by network members that cause a person to experience psychological distress such as resentment and sadness (Walden and Lachman, 2000).
- Social participation: the degree to which a person engages with their network.
- Formal social participation includes engagement in structured group activities such as sports, clubs, and community meetings.
- Informal social participation refers to a person’s frequency of contact with friends and family members.
1. Self-image and Belongingness: Gender Differences in How People Perceive Themselves in Relation to Others
In a seminal paper (Markus & Kitayama, 1991), psychologists described two different construals of the self – an independent view and an interdependent view. The differences between the two construals largely depend upon what role is assigned to others. For example, for the independent self, others are outside of the boundaries of the self; on the contrary, the interdependent self considers others within the boundaries of the self, and value relations with others as part of the defining features of the self.
The construals of the self, whether independent or interdependent, affect how we perceive relationships with friends and family, the emotions and feelings we exchange with them, and how sensitive and aware we are of others and their needs. The perception of the relative distance of self and others has profound implications for the quantity and quality of social ties.
Gender correlates with the construals of the self. Researchers found that men tend to have an independent self-construal, whereas women tend to maintain an interdependent self-construal. The differences in self-construals help explain many gender differences in cognitive, motivational, emotional, and social behaviors (Cross & Madson, 1997).
Despite the differences in the self-construals, both genders desire the feeling of belongingness. Men tend to seek social connections in a broader group (“tribal”), pursuing their belongingness by competing for power and status; on the contrary, women are more likely to focus on a few intimate dyadic bonds. Men tend to form larger groups organized around specific purposes, whereas women incline to nurture a tight circle of confidants, who they can count on during difficult times (Baumeister & Sommer, 1997; Zunzunegui et al., 2003).
Interestingly, the gender differences in social network inclusion and perceptions of others are manifested in children (Gifford-Smith & Brownell, 2003; Walker, 2010). A study following fourth- and fifth-grade children revealed a stronger “in-group, out-group” phenomenon among males than females (Benenson, 1990). The boys who belonged to a social network enjoyed significantly higher peer group acceptance ratings than girls who were part of social networks. Moreover, when asked to assign attributes to describe same-sex peers, boys were significantly more likely than girls to use words in categories such as academic ability, work habits, strange, athletic ability, interest, artistic, and academic ability. On the contrary, girls were significantly more likely to use words in categories such as nice and reciprocal.
As we shall see in the following sections, the mechanisms through which men and women identify themselves in relation to the surrounding environment affect both the width and depth of their social networks.
2. Gender Differences in the Quantity and Quality of Social Network
2.1 The quantity and composition of the network
Men and women have social networks of similar size (Dunbar & Spoors, 1995; Vandervoort, 2000), but show considerable differences in the content of networks. Women are found to have more kin (e.g., spouse, siblings, children, other family members) and fewer non-kin (e.g., friends, coworkers, acquaintances) in their networks than men (Marsden, 1987; Moore, 1990).
For men and women, a host of predictors, such as employment and education, exert different effects on their network composition. Considering the interaction effect of gender and employment status, researchers found that women, especially those not working full time, manage to maintain close connections to not only more kin, but also more diverse kin types than did men (Moore, 1990). For both genders, more education is associated with a more extensive social network, but for women only, the less-educated live closer to their social circles than the better-educated (Ajrouch et al., 2005).
Studies of a particular type of social network—workplace networks—have shown gender differences in network range, composition, and job leads. The network range demonstrates whether a person has contacts with people from a wide range of occupations. Network composition shows the proportion of a person’s network with high or low work status. Men are found to be more likely than women to know people in more diverse occupations, which gives them an advantage in job search and promotions. For women only, having young children is negatively correlated with both the network range and composition (CAMPBELL, 2016). Given the known importance of weak ties (Granovetter, 1973), the results imply that working mothers with young children may face a particular disadvantage in pursuing career opportunities, as their networks are often too narrow and singular to make vital connections for them.
Sometimes, the same social network channels may bring different career opportunities to men and women. Focusing on American adults in the labor force, researchers have found white men and white women to hold similar social capital (i.e., a combined indicator for network range and composition); however, white men receive significantly more job leads than white women (McDonald et al., 2009). The findings suggest that even when immersed in the same social network infrastructure, seemingly knowing the same people, men and women still retrieve uneven job information and job leads.
2.2 The perceived quality of the network and social support
Among all people in our social network, we turn to only a small subset of them to exchange deep feelings or to get help. Social support, by definition, is the fulfillment by others of either basic regular needs such as love and affection, confiding, reassurance, and respect, or more intense but time-limited needs such as caregiving after an adverse health shock (Cutrona, 1996). Existing research has demonstrated gender differences in the nature of the support system (Table 1).
Table 1: Social support style comparison by gender (T. C. Antonucci, 2001)
| Men | Women | |
|---|---|---|
| Characteristics of social relationships | Less intimate Less intense |
More intimate More intense |
| Size of the social support net | Smaller | Bigger |
| Receiving support when needed | Primarily from spouse | From more diverse sources |
| Giving support when needed | Less likely | More likely |
| Internalizing other people’s problems? (e.g., feeling responsible for and trying to solve others’ problems) | Less likely | More likely |
| Emotional towards close relationships | Less intense emotions | More intense emotions |
| Having strong positive feelings (e.g., affection) toward close relationships? | Less likely | More likely |
| Having strong negative emotions (e.g., frustration, conflict, disagreement) toward a close relationship? | Less likely | More likely |
Compared to men, women provide more frequent and more effective social support to others (Belle, 1991), and they generally report having more intimate relationships, of higher quality and more intensity. Such characteristics of women’s social support system have brought both benefits and strains to them (T. C. Antonucci, 2001). When facing challenges, women can amass social supports from multiple resources, relying less heavily than men on the spouse (Gurung et al., 2003; Lynch, 1998). On the other hand, friendships between women tend to be exclusive and intense, with the emphasis placed more often on loyalty, confidence, commitment, and effective aid (Rawlins, 2017). Female socialization prizes conflict resolution and nurturance (Francis, 1997). Women are more likely than men to internalize other people’s problems by taking personal responsibility and finding solutions for their friends and family (T. C. Antonucci, 2001). Being highly involved or overinvested in relationships makes women great sources of support, but also makes them vulnerable to emotional burdens. Maintaining a deep bond, whether with friends or family, can be overwhelming to women. Even though women report having more social support and contacts, which is supposed to reduce depressive symptoms, they also exhibit higher levels of depression than men (Turner, 1994).
Research has shown that, men exchange support primarily with their spouses, whereas women do so with both their spouses and other social connections like friends and children. Figure (1) summarizes some key findings by Antonucci & Akiyama (1987): a higher percentage of men than women receive emotional support, including confiding, reassuring, and respect, from a spouse; however, a higher percentage of women than men receive much emotional support from children. Among those giving social support (not shown in the figure), men are most likely to support their wives, particularly by confiding, talking when upset, and talking about health. A more substantial proportion of women than men offer their children and friends emotional support.

Figure 1: Proportion of people receiving support from different sources (T. C. Antonucci & Akiyama, 1987)
2.3 Social Participation
Social participation is defined as an engagement in formal or informal social activities. Formal, structured activities include community meetings, sports, club, political or religious group activities, and volunteering obligations. Informal social activities refer to in-person meetings, phone calls, and other communications with friends or family members not living together.
The existing literature doesn’t provide much quantitative evidence on gender differences in social participation across age. Hence, we make use of the Midlife in the United States data to examine whether men and women differ in their involvement in social activities and contacts with social circles. As shown in Figure (2), women are more engaged than men in religious activities,1 but the difference exists only among those over 50 years old. Meanwhile, men and women show similar attendance in non-religious activities, such as professional/union meetings, sport, and social gatherings, across age groups. Neither gender appears particularly involved in non-religious activities, with their attendances hovering around twice a month.
1 For a full discussion of gender orientation in religiosity, see (Francis, 1997).
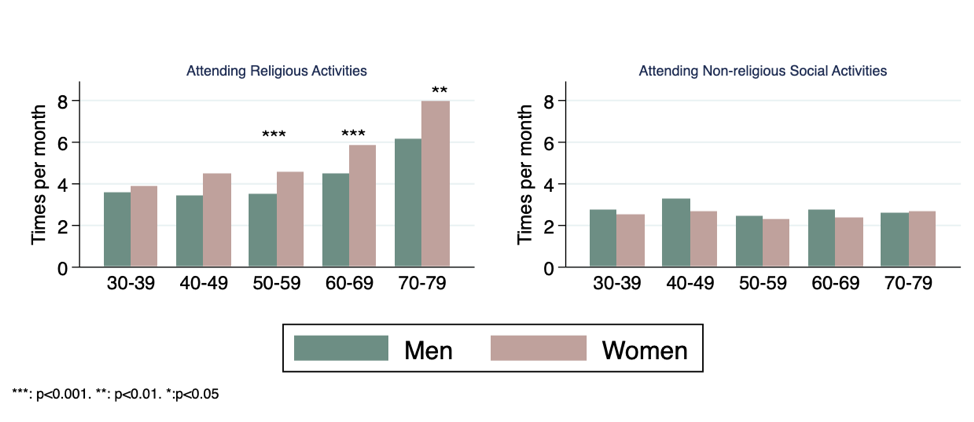
Figure 2: Women over age 50 attend more religious activities than men of the same age (MIDUS data, author’s calculation)
In terms of informal social participation – reaching out to one’s social circle by in-person meetings, phone calls, or emailing/writing, women exhibit a higher level of engagement than men. Women across all ages are more likely than men to maintain frequent contacts with non-cohabiting family members (Figure 3), which is consistent with the previous discussions about women embracing more kin and more diverse kin types in their social network.
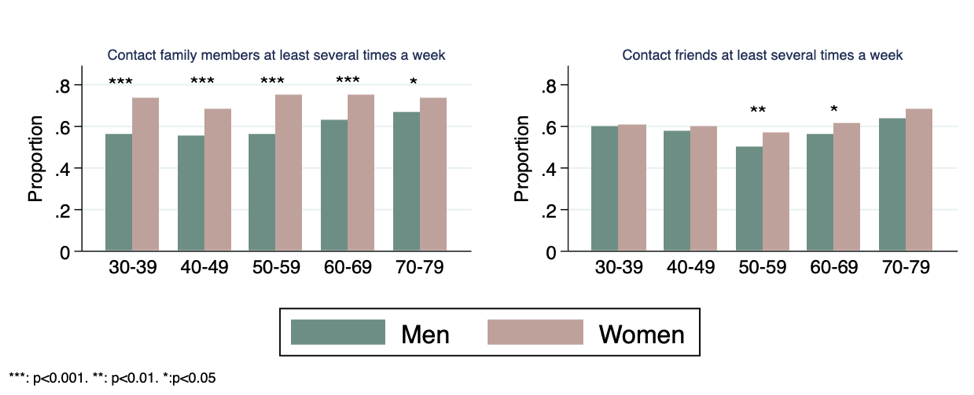
Figure 3: Women are more likely than men to contact their family and friends at least several times a week (MIDUS data, author’s calculation)
3. Gender differences in the effect of social relationships on health and subjective wellbeing
Many studies have shown the beneficial effects of social integration on reducing premature mortality and improving mental and physical health. However, such protection exhibits varying strength between men and women depending upon the specific social integration measures. As discussed below, for men, it’s marriage and active social participation that shield them most from premature death; for women, it’s high-quality connections that boost their life satisfaction and happiness.
3.1 Social engagement that helps men more than women
Marriage, involvement in certain social activities, and the network size have shown to have a more substantial beneficial effect on physical health for men than for women (House et al., 1982; Orth-Gomér & Johnson, 1987; Schoenbach et al., 1986). A high level of social activities and outdoor activities has a protective effect against non-cancer mortality for men (Lee et al., 2001).
Men appear to benefit more than women from marriage. Married men consider themselves happier, more satisfied, and less depressed than married women. Widowhood is more devastating, with a strong depressive effect for older men but has a weaker or nonsignificant effect for women (Lee et al., 2001; van Grootheest et al., 1999). Following the death of a spouse, women exhibit considerable resilience and ability to adapt (Wilcox et al., 2003).
Participation in outdoor activities and group activities (e.g., attending voluntary associations meetings, spectator events, classes, or lectures) were found to reduce men’s mortality rate. In contrast, indoor, passive activities such as watching TV were found to be positively associated with mortality. For women, the effect of the activities mentioned above on mortality is either weak or nonsignificant (House et al., 1982).
Instead of focusing on a single health outcome variable like mortality, one can examine a composite of health outcomes. One such measure is allostatic load, which summarizes levels of physiological activity across multiple regulatory systems using indicators such as blood pressure, waist/hip ratio, serum high-density lipoprotein, blood plasma, urinary cortisol excretion, and others. Seeman et al. (2002) found that older men with more social ties and more frequent social contacts were significantly less likely to suffer from a high allostatic load, but the same result doesn’t hold for women.
Other researchers use the Nagi physical functioning scale, which measures a person’s perceived difficulty in performing physical tasks such as pushing/pulling large objects, stooping/kneeling, lifting/carrying 10 pounds, reaching/extending arms, and writing/handling small objects. For both genders, people with more social ties at baseline reported a less functional decline in the following years. Still, the beneficial effect of social relations is more robust for men than for women (Unger et al., 1999).
3.2 Social engagement that helps women more than men
For women, it’s usually the quality of social support that matters most in shielding them from depression, and lifting their emotional wellbeing, as measured by life satisfaction and happiness.
Women appear to enjoy a higher level of satisfaction if they maintain close, interpersonal relations with others. In contrast, men’s life satisfaction is not strongly associated with their interpersonal relationships with anyone other than a spouse (Cheng & Chan, 2006). Older men report greater satisfaction with marriage than older women, but older women are more satisfied with friends than men (T. C. Antonucci & Akiyama, 1987). Both men and women benefit from more visual contact with relatives, but engagement with friends is protective for cognitive decline in women but not in men (Zunzunegui et al., 2003)
In times of adverse life events such as the death of a spouse, illness, and financial strains, does the lack of social relationships exacerbate people’s levels of depression? Researchers found that in France, Germany, and Japan, women with more negative social relationships exhibit higher levels of depressive affect in times of hardship (Unger et al., 1999). The same results don’t hold for men.
4. Summary
This chapter reviews studies on gender differences in social engagement patterns and behaviors. Gender plays an important role in self-construals, the quantity and quality of the network, and the level of social participation. Regarding the effect of social engagement on health and subjective wellbeing, men and women appear to benefit from different aspects of social integration and connections.
Takeaways
- Compared to men, women’s social network consists of more kin than non-kin, which helps women keep blood relations close, but puts them at a disadvantageous position in job search and other career opportunities.
- Men rely primarily on their spouses for social support, whereas women resort to more diverse sources of support.
- Compared to men, women’s friendship tends to be more intense, with a higher level of personal involvement. Such a relationship style equips women with the necessary support when needed, but makes them more susceptible to emotional burden and guilt.
- Compared to men, women are significantly more connected to non-cohabiting family members and friends, via in-person meetings, phone calls, and writing.
- The modes of social integration affect wellbeing differently for men and women. For men, outdoor group activities and strong social ties (including marriage) help lower mortality; for women, the quality of social support matters most in shielding them from depression and boosting their life satisfaction.
Acknowledgement: We thank Sasha Shen Johfre and Hsiao-Wen Liao for their insights and valuable comments.
References
Ajrouch, K. J., Blandon, A. Y., & Antonucci, T. C. (2005). Social Networks Among Men and Women: The Effects of Age and Socioeconomic Status. The Journals of Gerontology: Series B, 60(6), S311–S317. https://doi.org/10.1093/geronb/60.6.S311
Antonucci, T. C. (2001). Social relations: An examination of social networks, social support, and sense of control. In Handbook of the psychology of aging, 5th ed (pp. 427–453). Academic Press.
Antonucci, T. C., & Akiyama, H. (1987). An examination of sex differences in social support among older men and women. Sex Roles, 17(11), 737–749. https://doi.org/10.1007/BF00287685
Antonucci, T., Lansford, J., Akiyama, H., Smith, J., Baltes, M., Takahashi, K., Fuhrer, R., & Dartigues, J. (2002). Differences Between Men and Women in Social Relations, Resource Deficits, and Depressive Symptomatology During Later Life in Four Nations. Journal of Social Issues, 58, 767–783. https://doi.org/10.1111/1540-4560.00289
Baumeister, R. F., & Sommer, K. L. (1997). What do men want? Gender differences and two spheres of belongingness: comment on Cross and Madson (1997). Psychological Bulletin, 122(1), 38–44; discussion 51-55. https://doi.org/10.1037/0033-2909.122.1.38
Belle, D. (1991). Gender differences in the social moderators of stress. Columbia University Press.
Benenson, J. F. (1990). Gender Differences in Social Networks. The Journal of Early Adolescence, 10(4), 472–495. https://doi.org/10.1177/0272431690104004
CAMPBELL, K. E. (2016). Gender Differences in Job-Related Networks: Work and Occupations. https://doi.org/10.1177/0730888488015002003
Cheng, S.-T., & Chan, A. C. M. (2006). Relationship With Others and Life Satisfaction in Later Life: Do Gender and Widowhood Make a Difference? The Journals of Gerontology: Series B, 61(1), P46–P53. https://doi.org/10.1093/geronb/61.1.P46
Cross, S. E., & Madson, L. (1997). Models of the self: Self-construals and gender. Psychological Bulletin, 122(1), 5–37. https://doi.org/10.1037/0033-2909.122.1.5
Cutrona, C. E. (1996). Social Support in Couples: Marriage as a Resource in Times of Stress. SAGE Publications.
Dong, G., Wang, L., Du, X., & Potenza, M. N. (2018). Gender-related differences in neural responses to gaming cues before and after gaming: Implications for gender-specific vulnerabilities to Internet gaming disorder. Social Cognitive and Affective Neuroscience, 13(11), 1203–1214. https://doi.org/10.1093/scan/nsy084
Dunbar, R. I. M., & Spoors, M. (1995). Social networks, support cliques, and kinship. Human Nature, 6(3), 273–290. https://doi.org/10.1007/BF02734142
Eagly, A. H. (2013). Sex Differences in Social Behavior: A Social-role interpretation. Psychology Press.
Francis, L. J. (1997). The Psychology of Gender Differences in Religion: A Review of Empirical Research. Religion, 27(1), 81–96. https://doi.org/10.1006/reli.1996.0066
Gifford-Smith, M. E., & Brownell, C. A. (2003). Childhood peer relationships: Social acceptance, friendships, and peer networks. Journal of School Psychology, 41(4), 235–284. https://doi.org/10.1016/S0022-4405(03)00048-7
Granovetter, M. S. (1973). The Strength of Weak Ties. American Journal of Sociology, 78(6), 1360–1380. https://doi.org/10.1086/225469
Gurung, R. A. R., Taylor, S. E., & Seeman, T. E. (2003). Accounting for changes in social support among married older adults: Insights from the MacArthur Studies of Successful Aging. Psychology and Aging, 18(3), 487–496. https://doi.org/10.1037/0882-7974.18.3.487
House, J. S., Robbins, C., & Metzner, H. L. (1982). The association of social relationships and activities with mortality: Prospective evidence from the Tecumseh Community Health Study. American Journal of Epidemiology, 116(1), 123–140. https://doi.org/10.1093/oxfordjournals.aje.a113387
Lee, G. R., DeMaris, A., Bavin, S., & Sullivan, R. (2001). Gender differences in the depressive effect of widowhood in later life. The Journals of Gerontology. Series B, Psychological Sciences and Social Sciences, 56(1), S56-61. https://doi.org/10.1093/geronb/56.1.s56
Lynch, S. A. (1998). Who supports whom? How age and gender affect the perceived quality of support from family and friends. The Gerontologist, 38(2), 231–238. https://doi.org/10.1093/geront/38.2.231
Markus, H. R., & Kitayama, S. (n.d.). Culture and the Self.”Implications for Cognition, Emotion, and Motivation. 30.
Marsden, P. V. (1987). Core discussion networks of Americans. American Sociological Review, 52(1), 122–131. https://doi.org/10.2307/2095397
McDonald, S., Lin, N., & Ao, D. (2009). Networks of Opportunity: Gender, Race, and Job Leads. https://doi.org/10.1525/sp.2009.56.3.385
Moore, G. (1990). Structural Determinants of Men’s and Women’s Personal Networks. American Sociological Review, 55(5), 726–735. JSTOR. https://doi.org/10.2307/2095868
Orth-Gomér, K., & Johnson, J. V. (1987). Social network interaction and mortality: A six year follow-up study of a random sample of the swedish population. Journal of Chronic Diseases, 40(10), 949–957. https://doi.org/10.1016/0021-9681(87)90145-7
Rawlins, W. (2017). Friendship Matters. Routledge.
Schoenbach, V. J., Kaplan, B. H., Fredman, L., & Kleinbaum, D. G. (1986). SOCIAL TIES AND MORTALITY IN EVANS COUNTY, GEORGIA. American Journal of Epidemiology, 123(4), 577–591. https://doi.org/10.1093/oxfordjournals.aje.a114278
Seeman, T. E., Singer, B. H., Ryff, C. D., Dienberg Love, G., & Levy-Storms, L. (2002). Social Relationships, Gender, and Allostatic Load Across Two Age Cohorts. Psychosomatic Medicine, 64(3), 395. https://journals.lww.com/psychosomaticmedicine/Fulltext/2002/05000/Social_Relationships,_Gender,_and_Allostatic_Load.4.aspx
Social Support and Strain from Partner, Family, and Friends: Costs and Benefits for Men and Women in Adulthood—Heather R. Walen, Margie E. Lachman, 2000. (n.d.). Retrieved September 23, 2019, from https://journals.sagepub.com/doi/abs/10.1177/0265407500171001
Turner, H. A. (1994). Gender and social support: Taking the bad with the good? Sex Roles, 30(7–8), 521–541. https://doi.org/10.1007/BF01420800
Unger, J. B., McAvay, G., Bruce, M. L., Berkman, L., & Seeman, T. (1999). Variation in the Impact of Social Network Characteristics on Physical Functioning in Elderly Persons: MacArthur Studies of Successful Aging. The Journals of Gerontology: Series B, 54B(5), S245–S251. https://doi.org/10.1093/geronb/54B.5.S245
van Grootheest, D. S., Beekman, A. T. F., Broese van Groenou, M. I., & Deeg, D. J. H. (1999). Sex differences in depression after widowhood. Do men suffer more? Social Psychiatry and Psychiatric Epidemiology, 34(7), 391–398. https://doi.org/10.1007/s001270050160
Vandervoort, D. (2000). Social isolation and gender. Current Psychology, 19(3), 229–236. https://doi.org/10.1007/s12144-000-1017-5
Walker, S. (2010). Gender Differences in the Relationship Between Young Children’s Peer-Related Social Competence and Individual Differences in Theory of Mind. The Journal of Genetic Psychology. https://doi.org/10.3200/GNTP.166.3.297-312
Welin, L., Svärdsudd, K., Ander-Peciva, S., Tibblin, G., Tibblin, B., Larsson, B., & Wilhelmsen, L. (1985). PROSPECTIVE STUDY OF SOCIAL INFLUENCES ON MORTALITY: The Study of Men Born in 1913 and 1923. The Lancet, 325(8434), 915–918. https://doi.org/10.1016/S0140-6736(85)91684-8
Welin, Lennart, Larsson, B. O., Svärdsudd, K., Tibblin, B., & Tibblin, G. (1992). Social Network and Activities in Relation to Mortality from Cardiovascular Diseases, Cancer and Other Causes: A 12 Year Follow up of the Study of Men Born in 1913 and 1923. Journal of Epidemiology and Community Health (1979-), 46(2), 127–132. JSTOR. https://www.jstor.org/stable/25567270
Wilcox, S., Evenson, K. R., Aragaki, A., Wassertheil-Smoller, S., Mouton, C. P., & Loevinger, B. L. (2003). The effects of widowhood on physical and mental health, health behaviors, and health outcomes: The Women’s Health Initiative. Health Psychology, 22(5), 513–522. https://doi.org/10.1037/0278-6133.22.5.513
Zunzunegui, M.-V., Alvarado, B. E., Del Ser, T., & Otero, A. (2003). Social Networks, Social Integration, and Social Engagement Determine Cognitive Decline in Community-Dwelling Spanish Older Adults. The Journals of Gerontology: Series B, 58(2), S93–S100. https://doi.org/10.1093/geronb/58.2.S93